The Retirement Proving Ground
The “4% rule” has long been the go-to approach for drawing down income in retirement. But can one “rule” really apply to everyone? We look at some hypothetical examples to test out retirement income strategies.
The question “what now?” looms large for many of the roughly 11,000 Baby Boomers retiring daily. This applies to the choices they face around occupying their time, as well as the more immediate practical matters such as navigating the morass of Medicare decisions, claiming Social Security, and how to spend accumulated defined contribution assets so that they last for as long as they will live.
For the latter question, owing in large part to its simplicity, the 4% rule remains the preeminent rule-of-thumb for drawing down assets in retirement. In fact, 61% of advisors use the 4% rule when working with clients.1 Given the rule’s ubiquity, we decided to compare our IncomeWise™ retirement income strategy to the 4% rule to judge its relative merits. As a reminder, our IncomeWiseTM strategy pairs a deferred annuity (technically a qualified annuity contract, or “QLAC”) with a proprietary automatic spending methodology to draw down from a participant’s liquid assets and provide immediate monthly income.
In projecting outcomes, we developed the following personas and simulated their retirement outcomes. Let’s meet the retirees who will test out the different approaches to retirement income.
Stevie*
Stevie is a 62-year old retiree. She is retiring to serve as a caregiver for her husband (Mick, also aged 62). Her stylized circumstances featuring an early retirement are quite common: nearly 7 in 10 retirees indicate that the decision to retire was out of their control (with caregiving being one of the top reasons).2 Stevie saved in her 401(k) plan and accumulated a balance of $213,000.3 She plans on drawing down this balance, together with Social Security4 to fund retirement.
*The information contained above is for illustrative purposes only.
Let’s first examine the possibilities associated with the tried-and-true 4% rule. In this case, Stevie rolls her assets out of her employer-sponsored plan and invests the money in a balanced mutual fund.5 For the sake of simplicity, let’s assume her balanced mutual fund does not carry an expense ratio and that long-term returns align with the capital market expectations of State Street Global Advisors. Under the 4% rule, Stevie will keep the money invested in the fund and annually withdraw 4% of the initial balance. This withdrawal amount is updated every year for inflation.
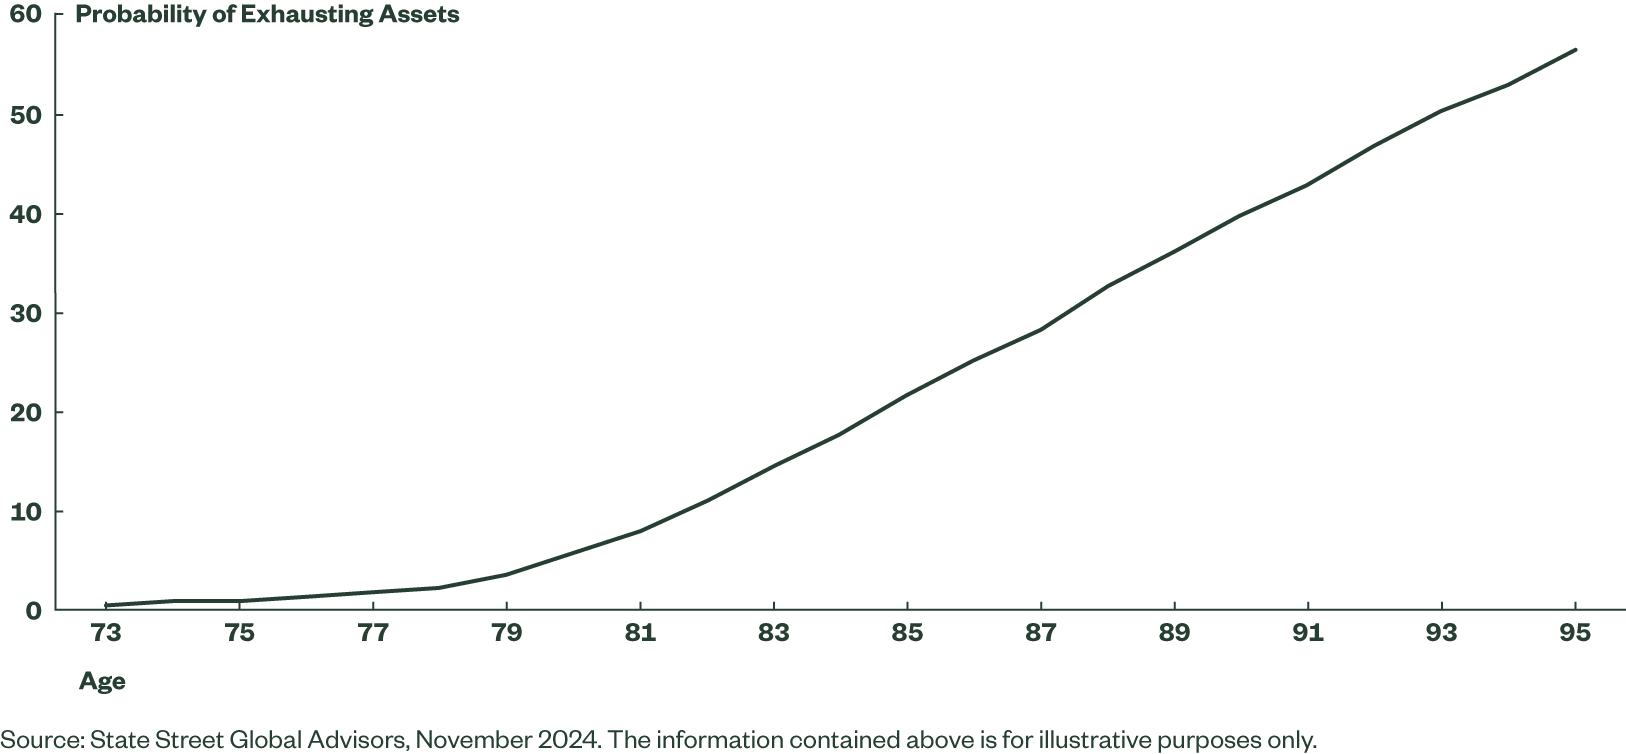
In simulating6 the possible outcomes, longevity risk rears its head. It combines with market risk to amplify uncertainty (think of it as turning up the volume knob on the uncertainty of outcomes). Under the 4% rule, the underlying investment fueling the withdrawals is subject to market risk. The market return does not directly impact the drawdown rate (4% of the initial balance adjusted annually for inflation), so there remains a very real risk of running out of money. Although Social Security provides a backstop, the liquid portion of Stevie’s nest egg could become prematurely exhausted.7 Figure 1 below illustrates the probability of exhausting assets at various ages.
Figure 1: 4% Rule Probability of Exhausting Assets

Although the probability of exhausting assets appears low, consider it in the context of joint life expectancy.
Figure 2: Probability of Attaining Ages for a 62-Year Old Couple8

Given that nearly half of the time, one or both individuals will live to 90, the 40% chance of exhausting assets by age 90 instills a little more anxiety than it would in the absence of such actuarial context.
Each month, Stevie draws down assets to pay expenses and experiences the market impact (could be good….could be bad) on her portfolio. Her initial balance predetermines the annual drawdowns; therefore, the only variables are whether the assets can sustain the drawdown and if Stevie and/or her husband are still living.
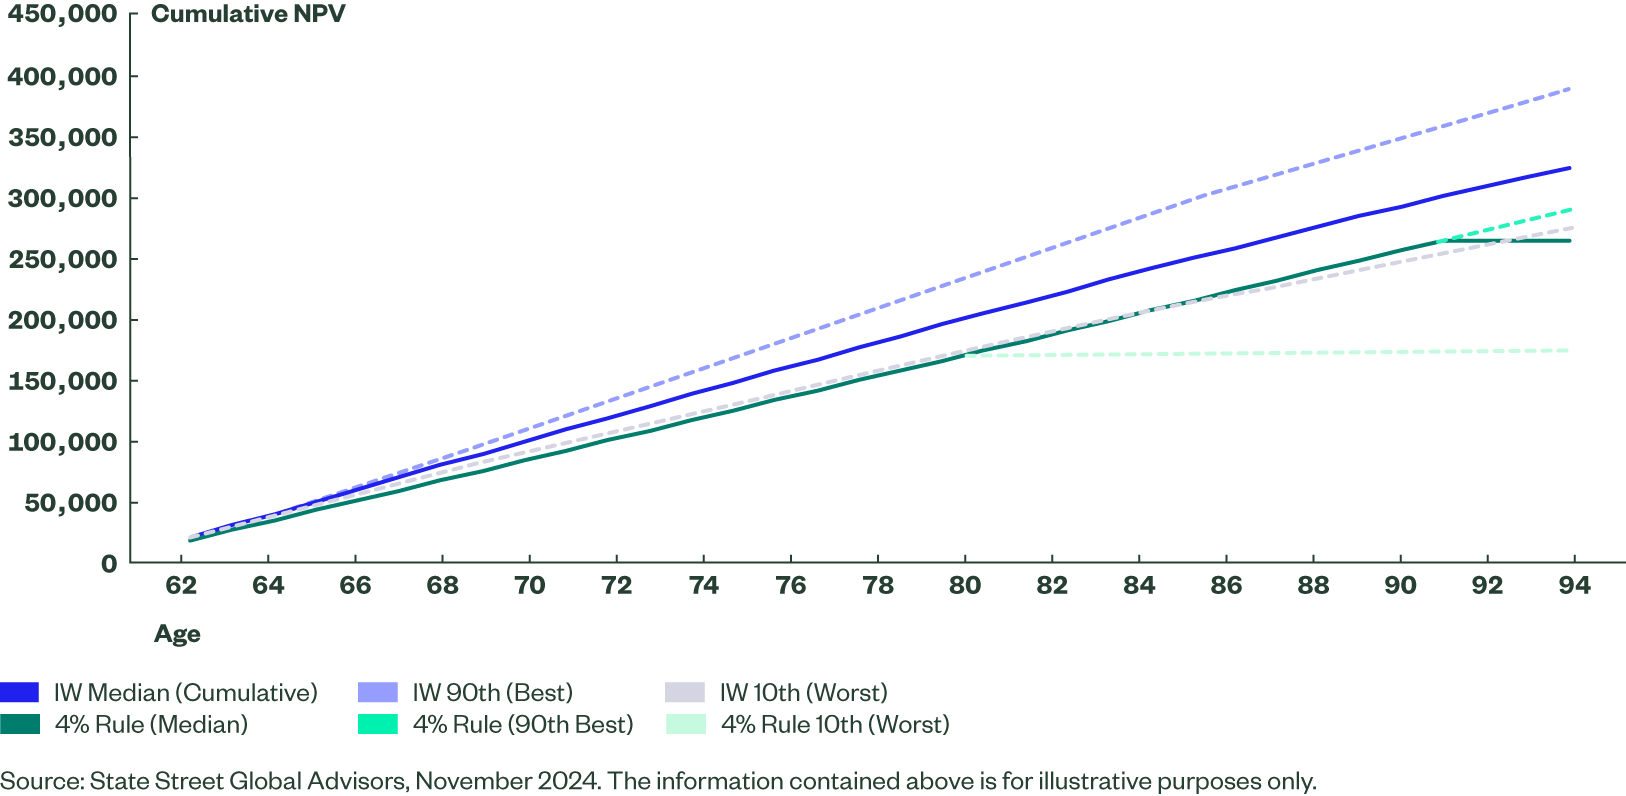
Figure 3: 4% Rule Outcomes (Age 62 to 95)

The figure above shows the cumulative total payouts9 as well as the remaining balance at age 95. The outcome for the 90th percentile is an example of an outcome where the balance is not exhausted and can sustain the 4% drawdown: basically all goes according to plan. The projected residual balances demonstrate the randomness of outcomes.
In the rosy outcome scenario (90th percentile), the remaining balance stays healthy at nearly $180k, meaning Stevie and her husband lived below their means in retirement and have assets for a sizable bequest. At the other extreme, the 4% drawdown prematurely depletes the balance, leaving Stevie and Mick with an exhausted balance (and, by extension, no bequest). In the negative balance scenarios, they would most likely adjust their spending as they see their balance depleting. This occurs, by age 95, in roughly 57% of the outcomes (see Figure 1, hence the median outcome is depleting assets by age 95).
Consider though if, instead of the 4%-rule, Stevie utilized a hybrid strategy that incorporates a guarantee in the form of a QLAC10 with a dynamic spending strategy. State Street Global Advisors utilizes such an approach with our IncomeWise™ retirement income solution.11 In the IncomeWise™ scenario, Stevie opts to use 25% of her defined contribution balance to purchase a QLAC. The remaining 75% of her balance remains liquid and is drawn down according to State Street’s spending methodology. The IncomeWise results are captured in Figure 4 below.
Figure 4: Comparison of 4% Rule to IncomeWise

Figure 5: Cumulative Payments

In comparing outcomes, the IncomeWise approach provides for higher income levels across the various scenarios (e.g., “the good” — 90th, and the “not-so-good” — 10th worst). In fact, the IncomeWise approach, largely due to the fact that its methodology is able to respond to market movements, provides better spending outcomes (61% and 35% better) when there are extreme outcomes, both good and bad. This stability owes in large part to the fact that from age 78 on, a large proportion of Stevie’s income comes in the form of guaranteed payouts from the QLAC she previously purchased.
It is important to note that, with the 4% rule, there is more upside in the form of a residual balance relative to the IncomeWise approach. However, this must be weighed against the chance of assets being fully depleted. The safety of the QLAC ensures Stevie and Mick are protected if the landslide brings them down; at the same time, the spending methodology doesn’t stop them thinking about tomorrow — and this flexible adjustment provides for better-managed, consistent spending throughout retirement.
What about Bob*?
Our next retiree is Bob. Bob is 68, married to Lindsey (also aged 68), and worked in trucking and logistics for 30 years for the same employer. Given his long tenure, Bob accumulated a balance of $420,00012 in his employer-sponsored defined contribution plan. Bob expects to spend down his defined contribution assets to augment his Social Security benefits ($3,835/month per the Social Security Benefits Calculator). As with Stevie, we examine the potential outcomes for Bob under the 4% rule as well as the dynamic spending approach.
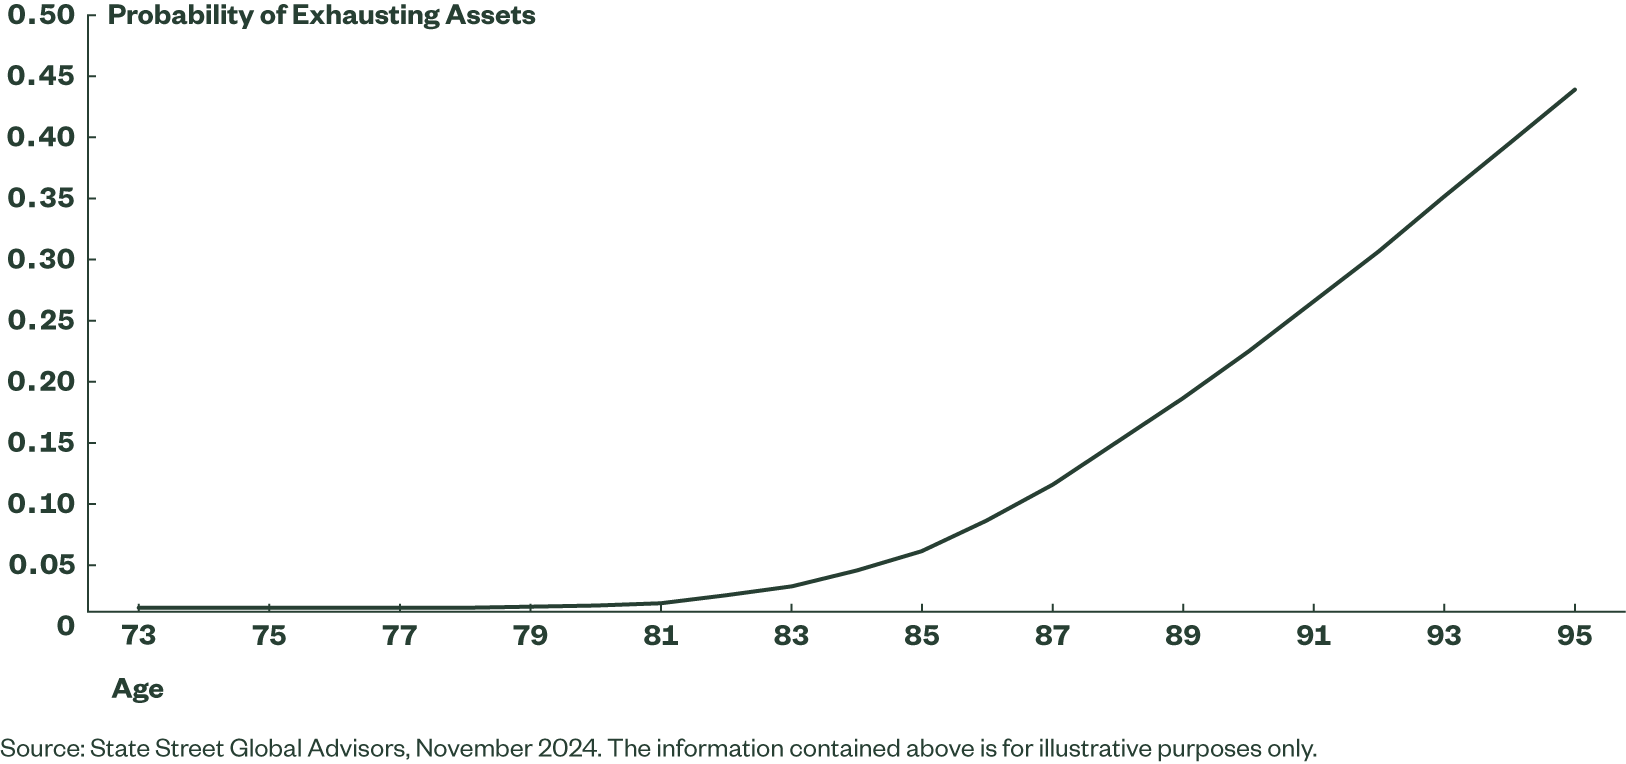
Figure 6: 4% Rule Probability of Exhausting Assets

Under the 4% scenario, starting the drawdown six years later means the odds of depleting assets are lower than in the case when the drawdown occurs at age 62. This makes intuitive sense; with less time to deplete assets, there is less probability of running out of money. The roughly 20% probability of exhausting assets by age 90 is weighed against a roughly 50/50 chance of one or both being alive at age 90.
Figure 7: Probability of Attaining Ages for a 68-Year Old Couple13

Figure 8: 4% Rule Outcomes (Age 68 to 95)

Note that the 90th and Median outcome are the same. Since the 4% rule calls for a set amount of spending, in both the 90th and Median cases, assets are there to meet the preset distribution amount, therefore the outcomes are same. So in a sense, the upside scenarios are captured in the residual balance.
Over the extended time horizon (up to age 95), the residual balance shows a wide range of potential outcomes. In the rosiest 10th percentile, Bob and his wife would leave behind a nearly $400,000 bequest, while in the 10th-worst percentile, they exhaust assets (at age 95, assets are exhausted at the 40th percentile of outcomes and below). Overall, the 4% rule fares better with the shorter time horizon. As in the case of Stevie, variability in projected outcomes must be weighed against participants’ preferences for stability and predictability.
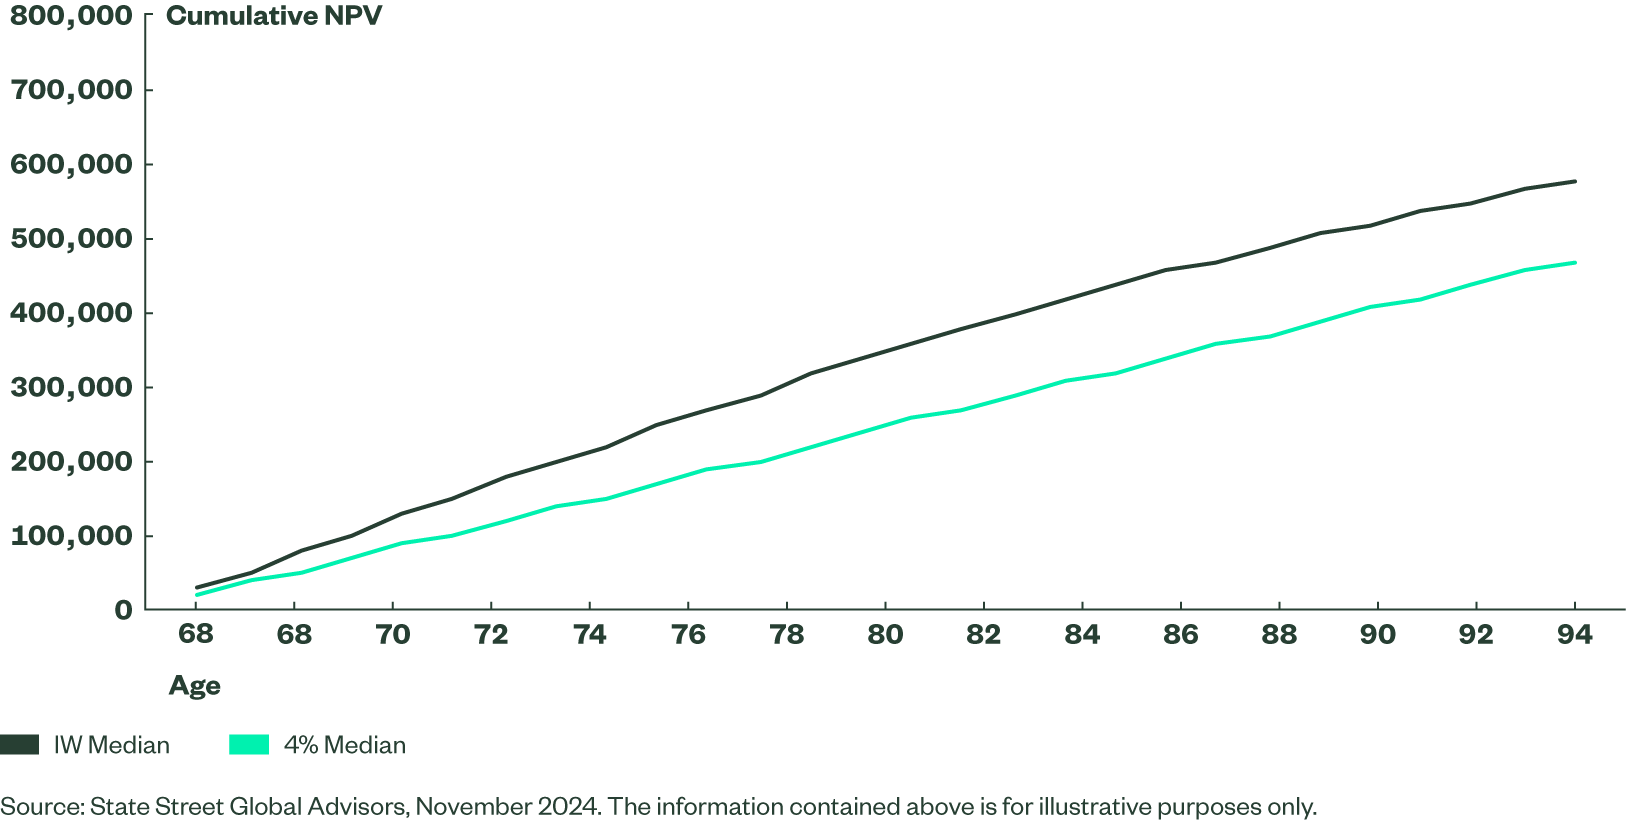
Instead of the 4% rule, Bob could utilize the in-plan retirement income option. In this case, Bob uses 15% of his balance to purchase a QLAC and employs the dynamic spending strategy with his remaining assets. Figures 9 and 10 below summarize the projected outcomes.
Figure 9: Comparison of 4% Rule to IncomeWise

Figure 10: Cumulative Payouts (68–95)

Similar to Stevie, Bob achieves a higher cumulative payouts and a lower variability in outcomes. But this comes with a cost: he does not have the upside in his projected balance (though he likewise cuts off the downside). From age 78, the QLAC and dynamic spending approach provides Bob with a portion of his retirement income guaranteed (QLAC payments + Social Security) while spending from his liquid defined contribution assets reacts to market movements.
In both the case of Stevie and Bob, quantitative analysis struggles to address the other benefit of an embedded guarantee: peace of mind. Knowing that some portion of income is “guaranteed” and insulated from market returns brings a certain psychological benefit. Although we do not factor this into our analysis, it is important to mention. Research supports this point. A study of truck drivers found a link between financial well-being and lower accident rates.14 Another study found15 that retirees will spend twice as much each year in retirement if they shift investment assets into guaranteed income wealth. Taken together, one can infer material benefits from a guarantee that falls outside of the net-present-value measure we used.
The Bottom Line
For participants as different as Stevie and Bob, the QLAC + dynamic spending approach yields higher income (6% and 9% respectively) over the observed time horizon compared to the 4% rule. The advantages extend to a narrower range of potential outcomes as well as the peace of mind that comes with a guarantee. While these advantages must be weighed against the upside in residual balance provided by the 4% rule, that is the beauty of optional income features. Both Stevie and Bob have the option to model out these outcomes and, if desired, elect these retirement income plans — giving themselves a better outcome at the median and reassurance for any storms that may come.