Systematic Investing in Credit Is Now Feasible
Regulatory changes and technological advances have dramatically improved liquidity and transparency in corporate bond trading, making systematic credit investing a viable and an attractive proposition for today’s investors.
Investors in equity markets have embraced systematic investing for a long time. These highly developed systematic, quantitative strategies cover a broad spectrum of time horizons, from milliseconds to months; most geographies; and a broad range of issuers with different market capitalizations. But because of the more complex nature of credit markets, fixed income investors have been slower to embrace this type of investing.
However, over the past few years, several market and regulatory developments have led to slow but steady changes in the credit trading environment and reduced this asymmetry between credit and equities.
Systematic Equities Had a Head Start…
Success in systematic equities has been driven predominantly by the information introduced to the portfolio through factor analysis, models, and data. Implementation — sourcing the securities to construct the portfolio — is straightforward, given that every security in the major indices trades regularly every day. Equities are mostly exchange traded; their historical pricing, transaction, and fundamental data have been broadly available from multiple vendors to academia and industry for decades. As a result, quantitative equity signals have been well researched, and standard sets of factors have emerged for alpha strategies and risk management.
On the other hand, corporate bond markets are more complex and substantially less liquid. A given company may have dozens of bonds outstanding, with different coupon levels, maturity dates, optionality, and seniority. Some of these, particularly older and smaller issues, may hardly trade at all. Until recently, corporate bonds traded mostly over-the-counter (OTC), and price discovery was opaque. The cost of trading credit was therefore significantly higher than for equities, and in ‘risk-off’ crises, trading in credit could come to a near halt. Few vendors offered bond-level historical pricing data and analytics. Bond security analytics require complex modeling of the price effect of interest rates and default expectations, which need to be consistent across fixed income asset classes. Changes to these models often require updating analytics historically — always a costly endeavor. Most importantly, credit portfolio managers believed that algorithms based on historical patterns will always miss important bond characteristics and cannot be implemented in practice, due to high trading costs.
Corporate bond liquidity declined even further in the aftermath of the Global Financial Crisis (GFC) of 2008, when regulators imposed a number of new constraints on financial institutions. Primary among these was the Dodd-Frank financial reform enacted in 2010. This legislation raised the regulatory capital requirements for banks, making it much more expensive for broker/dealers to maintain inventories of corporate bonds. Thus, even after the crisis had largely subsided, corporate bond markets remained substantially less liquid than they had been before the crisis.
This manifested itself in a reduction in turnover and an increase in trading costs (as measured, for example, by average Liquidity Cost Scores (LCS)* in the investment grade (IG) and high yield (HY) markets. These new regulations encouraged banks to reduce proprietary trading and move risks off their balance sheets. Investors at first responded to higher trading costs by trading less and concentrating their activity in the most liquid parts of the market, namely the largest and most recent issues. These changes allowed investors to keep costs under control, at the expense of limiting the scope of their portfolio strategy. Indeed, security selection strategies often rely on taking positions in smaller, lower-rated issuers, many of which remained difficult or very expensive to trade.
* Liquidity Cost Scores (LCS) provide an estimate of the round-trip transaction cost of trading a bond, as a proportion of its market value, based on quotes from Barclays trading desks.
… But a Lane Has Cleared for Fixed Income
The need to maintain smaller balance sheets drove banks towards more of an agency model and encouraged them to participate in, or even develop, venues to match buyers with sellers. The extension of Trade Reporting And Compliance Engine (TRACE) requirements to include more OTC credit transactions gave researchers access to new trading data, increasing market transparency and opening new opportunities to study liquidity patterns. Market participants adopted new trading practices, aided in part by new technologies. The rise in the use of ETFs and portfolio trading in credit markets helped increase liquidity in otherwise illiquid segments of the bond market. Partially due to regulatory concerns, investment banks turned over production and dissemination of fixed income index data to vendors, which resulted in historical index data becoming more broadly available.
Increased Agency Trading
The first stage of market adaptation was marked by an increase in “agency trading,” as opposed to “principal trading.” Agency trading allows investors to trade less-liquid issues in a cost-effective manner, essentially trading by appointment. In this protocol, an investor gives a dealer an order, meaning the dealer is tasked with trading a specific bond at a specific price, and attempting to find the other side of the trade at (or close to) the requested price within a certain amount of time. If the market maker succeeds in finding a seller to match a buy order, it prints both sides of the trade at once; if not, the trade order goes unfilled. Using a detailed analysis of TRACE data, Meli and Gupta1 demonstrated that agency trades, or near-simultaneous matched buy and sell orders on the same bond, result in significantly lower transaction costs than principal trades, in which the dealer holds the bond on its books for a longer time between the two legs of a transaction. They also found that the prevalence of agency trading increased substantially from 2010 to 2015, especially for older, and thus less liquid, issues.
Rise of Credit ETFs
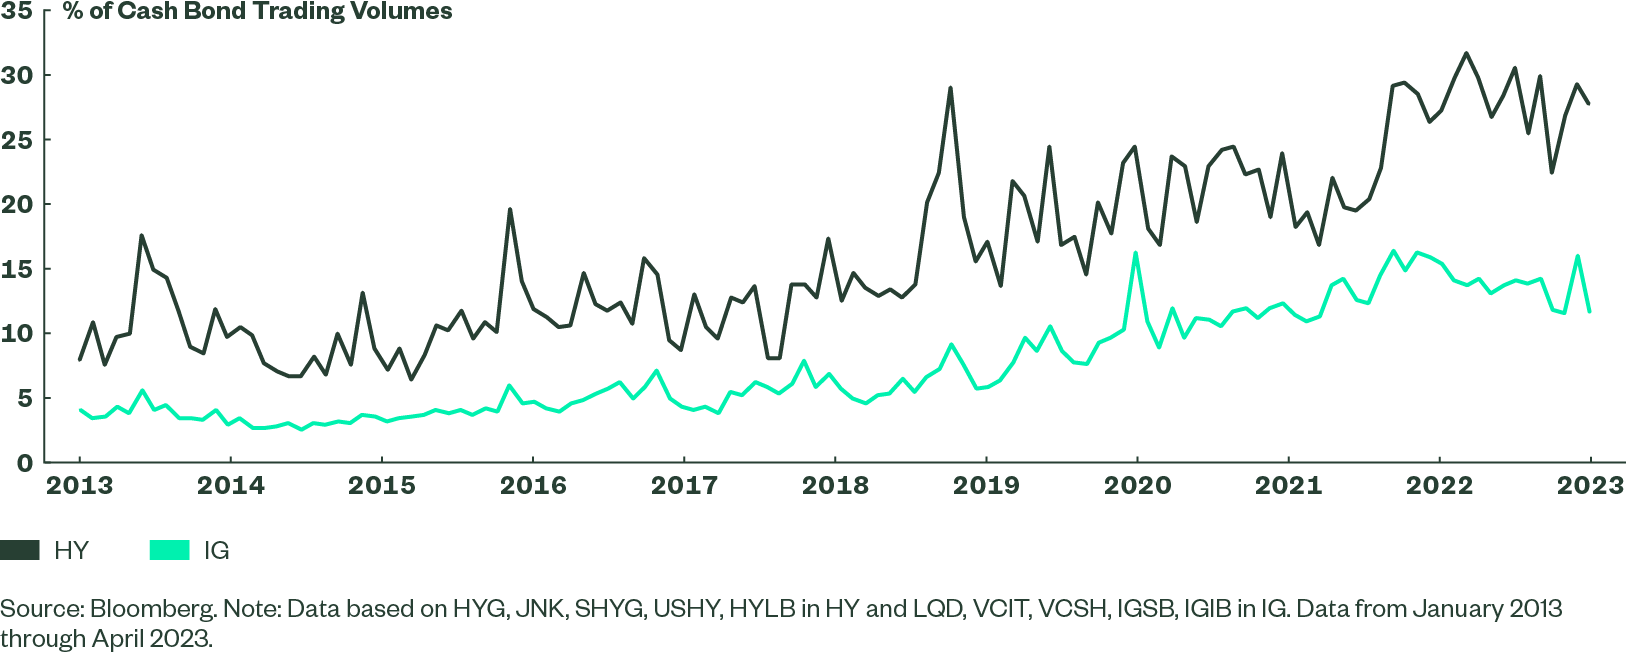
Another market development that has changed the credit trading landscape has been the rise of credit ETFs and their trading volume from institutions. Since their introduction in the early 2000s, they have grown dramatically in total assets and trading volumes. While the total market value of IG bonds and the AUM of IG ETFs are substantially larger than those of their HY counterparts, the ETF volumes in the two markets have tended to have similar magnitudes, even as they have both had tremendous growth. To emphasize the growth in importance of ETF trading within the context of overall market activity, Figure 1 shows the growth of IG and HY ETF trading volumes as a percentage of the overall trading volumes in cash bonds.
Figure 1 ETF Trading Volumes in US IG and HY Markets

This increased ETF activity affects liquidity in the underlying bond markets in two different ways. One, it creates an easy way for a credit portfolio manager to handle cash inflows (outflows) by buying (selling) shares in passive credit ETFs, which tend to be more liquid than many individual bonds. This causes some trading volume that would have previously flowed into individual bonds to be redirected onto ETFs, thus reducing turnover and, hence, liquidity in the underlying bonds.
However, secondly, the ETF ecosystem includes create/redeem activity, in which ETF shares are exchanged for baskets of individual bonds. This may serve to increase liquidity in the underlying bonds. Meli, Todorova, and Gupta2 have investigated both of these effects in the US IG and HY markets. They find clear evidence that HY fund managers increasingly use ETFs to manage their liquidity needs relating to fund flows. This makes sense because the leading ETFs are much more liquid than the underlying HY bonds. In both HY and IG, they report that bonds included in the largest ETFs tend to have better liquidity than excluded bonds with similar characteristics.
Furthermore, the rise of credit ETFs and index investing has allowed new market entrants and established new trading protocols for portfolios of bonds and ETFs. Large index managers are now a significant source of liquidity across a wide range of securities because institutions often hold multiple bonds in a single-line instrument via ETFs. Banks may now have ETFs, bond portfolios and index CDS in the same book of trading. ETFs now provide intraday views of supply and demand on various fixed income securities and afford insights into clearing prices.
Technological Advancements
Several key technological advancements have also helped improve liquidity in credit markets. Request-for-quote (RFQ) systems,3 introduced in the 1990s, have expanded to credit, list trading, basket trading, ETFs, and more recently, all-to-all trading. Large index managers that may hold tens of thousands of individual bonds can now leverage technology to find overlaps between their exposures, their “axes,” or the bonds they would like to own or sell and the axes of other market participants. Technology also provides scannable data on liquidity indicators such as issue size and age across thousands of bonds, allowing portfolio managers to view the fragmented fixed income market efficiently and make optimal trade-offs at a portfolio level. These developments are particularly important in the fixed income market, where liquidity is a crucial element of investment decisions. Electronic trading on various platforms has increased steadily in volume.
O’Hara and Zhou4 analyze trading data from MarketAxess and TRACE and show that the share of electronic trading in US IG corporate bonds, by volume, rose from about 10% in 2010 to about 25% in 2017. This effect is strongest for smaller trades; as of 2017, they show that nearly 50% of “odd-lot” trades of $100,000 to $1,000,000 trade electronically, while less than 10% of block trades of over $5,000,000 do. These larger institutional trades, which comprise more than half of total volume, still trade primarily by voice. However, the authors demonstrate that during this time, transaction costs decreased steadily for both electronic and voice-traded transactions.
The rise in proprietary trading firms also strengthened liquidity in the financial system. Post-GFC, as banks grappled with new regulations, prop firms filled the void by making markets and offsetting the fall in liquidity caused by banks’ lower appetite for holding risky assets on their balance sheets.
Portfolio Trading
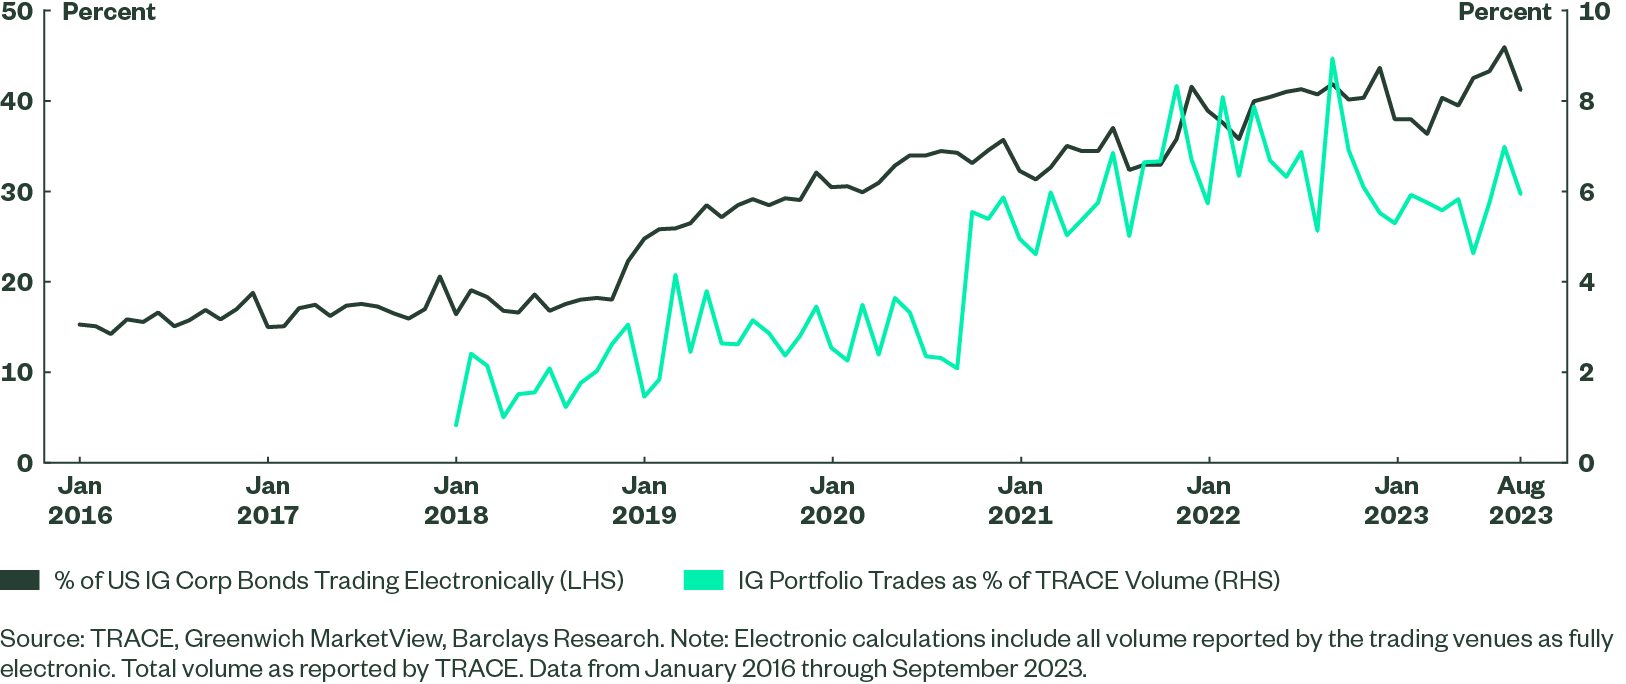
Finally, portfolio trading has emerged as a growing force in credit markets. While ETF trading improved liquidity for many IG bonds, this effect was mostly limited to those owned by ETFs, which tend to be the most liquid ones in the market. This effect provided little help to managers who sought to express relative value views about less-liquid issuers. The latest innovation in corporate bond markets, portfolio trading, offers more such help. In this new custom protocol, an investor can submit to one or more dealers a request for a buy or sell quote on a basket of bonds to be purchased in a single transaction. The number of trades executed using this protocol has grown over the past few years. Meli and Todorova5 have demonstrated that by including illiquid bonds in a portfolio trade along with more liquid ones, managers have been able to achieve a substantial reduction in transaction costs for the less-liquid bonds. Portfolio trading therefore presents an important new tool that enables systematic credit portfolio managers to transact efficiently in the securities with the desired factor exposures. Figure 2 details the recent growth in electronic trading and portfolio trading in the US IG corporate bond market over the past few years.
Figure 2 Increasing Roles of Electronic Trading and Portfolio Trading in US IG Corporate Bonds

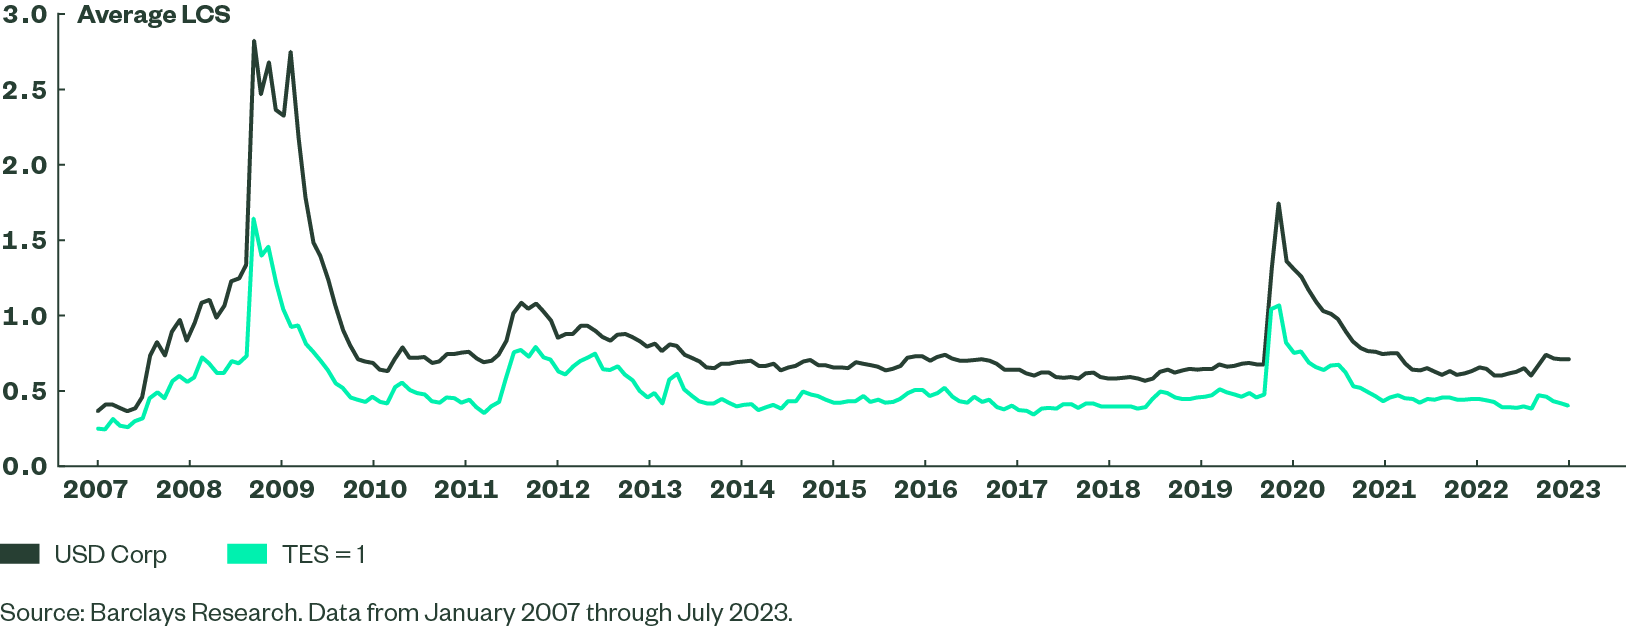
Figure 3 US IG Liquidity Has Improved Significantly Since 2010

Due to this combination of developments, corporate bond liquidity has improved substantially over the past decade, bringing down the cost of trading. Figure 3 shows how LCS has changed over time, for the average of all index bonds and for the most liquid segment, as measured by the Trade Efficiency Score (TES).6 We see that trading costs declined steadily from 2012 through 2018, and again following the COVID-19 shock of 2020. While the average LCS for the index has increased somewhat in 2023, this has not had a significant effect for the most liquid bonds, for which LCS is near its 2017 low, with an average round-trip transaction cost of about 0.4%.
As a result of these changes in the trading environment, systematic active strategies in credit have now become viable. Information about individual bonds, including pricing, liquidity, credit rating, and other characteristics, is more readily available. New trading venues and protocols give managers more flexibility in execution.
Data-driven, systematic security selection can thrive in this information-rich environment. A systematic approach to credit selection casts a wider net when seeking opportunities, as it evaluates the entire security universe when considering opportunities versus the more focused fundamental strategies. Furthermore, systematic strategies do not typically hold large, concentrated positions in individual securities, but rather take a diversified approach, with many small exposures. This strategy type suits a trading environment that is tilted toward electronic and basket trading and allows investors to benefit from scale efficiencies.
Defined Benefit plans face a variety of economic and market challenges over their lifetimes and need to manage for those risks – from inflation and interest rates, to market performance and volatility. Unlike an idiosyncratic active approach, which looks at a relatively small number of issuers and makes subjective, high-conviction calls, a SAFI approach is systematically applied to every security in the investable credit universe. This provides a larger opportunity set, while staying within the desired risk limits and controlling tracking.
More About SAFI
The data-driven insights in our Systematic Fixed Income strategies are informed by systematic signals delivered in the form of indices developed by the Barclays Quantitative Portfolio Strategy team, or QPS, which is well-recognized as an innovator in quantitative fixed income research. Their innovative signals and portfolio optimization methodologies form an important input to the process we, at State Street Global Advisors, use in the implementation and management of Systematic Active Fixed Income strategies.
Explore the State Street Global Advisors thought leadership series on Systematic Active Fixed Income investing to learn more about this innovative investment approach and its benefits.