Could Gold ETF Inflows Spur Record Gold Prices in 2025?
A reversal of the multi-year gold ETF redemption cycle appears bullish for bullion markets, supporting our bull case target of $3,100/oz gold in 2025.
Gold Bull Markets and Strong ETF Inflows
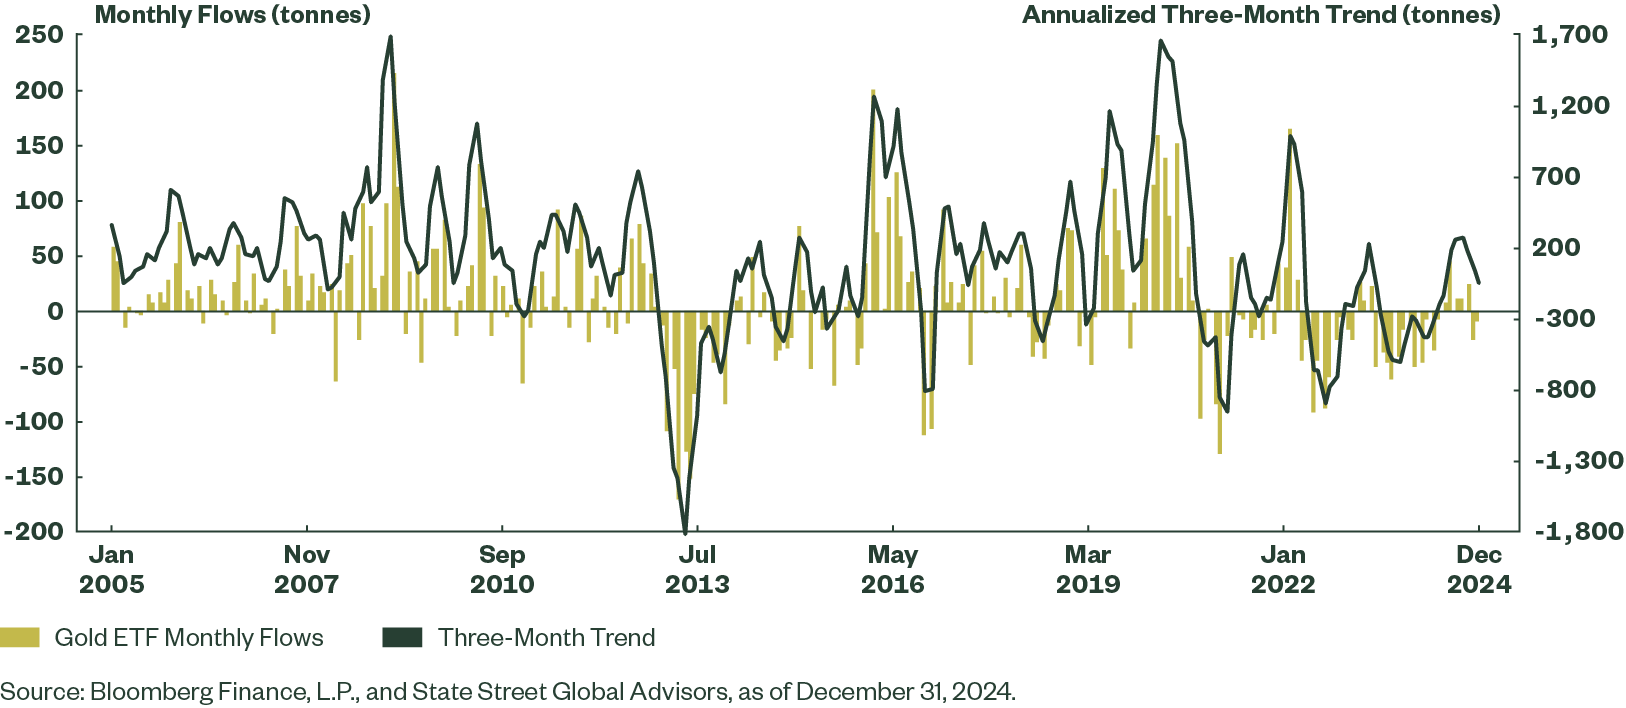
Sizable gold ETF inflows — on average about 30 tonnes (t)/month — have coincided with every gold bull market over the past two decades (2005-2007; 2009-2012; and 2019-2020).1 Yet despite gold’s 27% price rally in 2024, gold ETFs posted outflows, driven mostly by redemptions early in the year.2
In our view, there’s plenty of room for gold ETF inflows to play catch-up in 2025.
Record central bank gold demand and China’s recovering retail imports post-pandemic have helped to absorb ETF physical de-stocking since 2021.3 Yet if bullion ETF outflows from late 2020 to mid-2024 flip to even moderately strong inflows in 2025, that demand shock could boost gold prices by tightening fundamental balances.
Are 2024’s Gold ETF Outflows Masking a Bullish Shift?
To the extent that US real rates and Federal Reserve (Fed) hawkishness have peaked and demand for alternative fiat assets continues to gain traction, we see plenty of scope for a rebound in gold ETF holdings globally.
We also believe investor demand for gold tail hedges will likely increase in 2025 as the volatility compression theme wavers. Taking a step back, we already see that gold ETF inflows worldwide turned positive to total 63t from June through December, despite net selling pressure following the US elections. Notably, gold saw inflows of nearly 100t from June through October 2024 — a five-month stretch that was the longest sustained period of global gold ETF buying since 2020. Yet, global gold ETF holdings declined more than 26t in November and nearly 10t in December 2024.4
But don’t read too much into this normal seasonal pattern. End-of-year ETF flow dynamics are historically negative for gold, even during bullish runs — and especially in US election years. Indeed, November through December in both 2016 and 2020 saw approximately 220t and 125t of worldwide net outflows, respectively.5 Gold ETF outflows late in 2024 seem modest by comparison.
Figure 1: Global Gold ETF Monthly Flows and Trend (Tonnes)

Were Gold ETF Investors Balancing World Supply/Demand?
For three and a half years, from November 2020 to May 2024, gold ETF stockholders provided net supply for world gold consumers to the tune of 180-200t, on average, per year. During those 43 months, global bullion tickers posted net inflows in just 10 months!6
Global gold ETF assets under management fell below their 2020 peaks during 2021 to 2023 and moved mostly sideways before surging more than $40 billion in 2024 (Figure 2).7
But gold ETF investors who maintained exposure did not see an ongoing markdown in valuations. That’s because gold prices stayed historically elevated and were sticky at $1,800-2,000/oz, even as the Fed was hiking aggressively in 2022-2023.8 Other demand components buttressing bullion markets included Emerging Market and Developed Market Asian central banks as well as Chinese retail.
Thus, an ETF re-stocking cycle could be very bullish and help justify our case for gold to reach $3,100/oz.
Consider that in recent years, the 180-200t of annualized gold ETF redemptions were absorbed by both official sector sources9 (2022-2023) and record Chinese retail demand (2023-2024).10 If the pace of gold ETF buying in the latter part of 2024 continues in 2025 and even starts to accelerate, gold prices probably need to drift meaningfully higher to crowd out demand.
Some might argue that the ETF investor is not the biggest player in gold. We agree! But the delta, or change, in physical consumption patterns is critical for sentiment. For example, if global gold ETFs post net inflows of 150-160t in 2025 (similar to the June-October 2024 pace), that would represent a significant 400t increase in demand growth from 2023 to 2025.11
ETF investment in this scenario would represent the biggest spike in gold sector consumption growth. More importantly, gold markets would be grappling with ETFs suddenly transitioning from a source of net supply to a source of net demand.
Could ETF Investors Tighten Gold’s Physical Market?
Gold’s both a financial instrument and physical asset. So, gold ETF inventories have been critical for physical markets because recycling activity for the metal has been sluggish post-pandemic. Gold ETF sell orders shifting to buy orders (beyond being a bullish financial market signal) could thus further tighten physical supply.
The supply slide of the fundamental gold balance is as follows: Gold Supply = Production + Net Hedging Supply + Recycling Scrap.
Gold scrap has been ~25% of annual supply over the past half-decade, but historically it’s reacted more positively to higher prices (e.g., in 2010-2012 it was ~35% of total supply).12 This impulse has been weak over the past decade, but is particularly surprising since 2020, given record high gold prices in US$ terms and particularly in non-US$ terms.
There are a lot of factors at play here. Yet, similar to how a step change in ETF demand might crowd out other gold consumers, we find it plausible that ETF investors starting to buy gold as opposed to supply gold should require a higher gold price regime to kickstart a scrap response.
Flow Cycles and Positioning Matter for Gold
Global gold ETF investors unwound a hefty 930t from November 2020 through May 2024. And despite a bullish price rally and record nominal prices being achieved across all major G10 currencies in 2024, global gold ETF holdings are still down ~25% from their all-time highs in October 2020.13 Tactical sellers with FOMO for tech equities or concern about Fed hikes likely rotated out of gold ETFs or took some profits post-pandemic. So gold ETF holdings and financial flows seem historically subdued when compared to bull regimes over the past two decades.
But that seems to have started to turn in the latter part of 2024. And the Fed and rates market could lend a helping hand going forward.
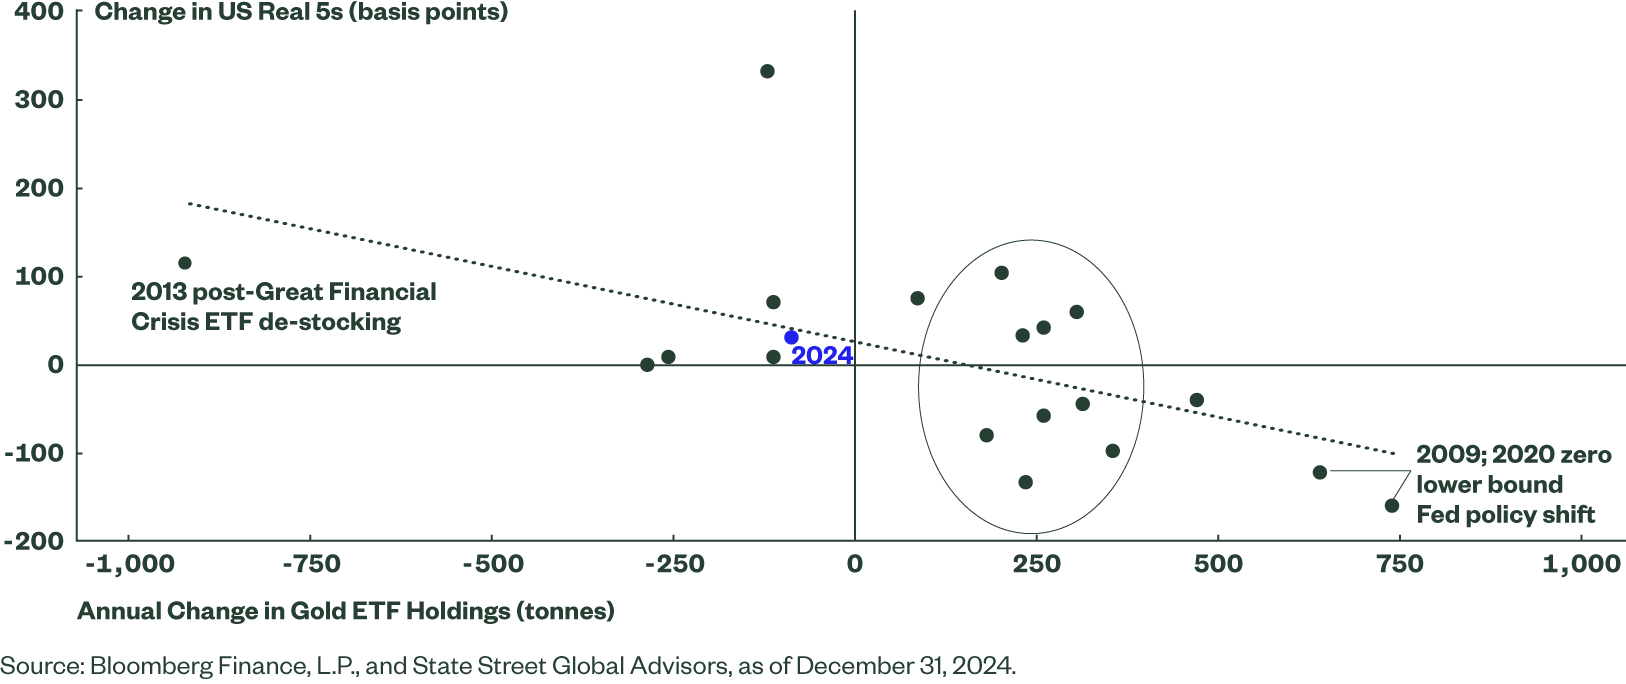
Though the relationship can vary, gold ETF inflows tend to be stronger when US real interest rates are falling. This was most notable during 2009 and 2020 (Figure 4) when the US central bank cut policy rates to the zero lower bound (ZLB).14
Figure 4: Falling US Interest Rates Historically Have Boosted Gold ETF Inflows

Though it is highly improbable that the Fed will be easing so aggressively this cycle due to a (still) strong labor market and lingering concerns about inflation pressures, further policy normalization in 2025 appears likely. Money market traders continue to price in two to three cuts later this year.15 This can support the bullion price and ETF inflows by reducing the opportunity cost of holding a zero coupon asset such as gold.
In addition, US domestic policy remains highly fluid and uncertain given the incoming Trump administration. Chair Powell’s press conference following the December 2024 FOMC alluded to a potential clash in policy goals over the next six to 12 months. This could buttress bullion inflows to the extent an uncertainty premium lifts asset market volatility, increases drawdown risk, and boosts demand for perceived safe havens.* On the other hand, potential inflationary policies (e.g., fiscal, trade channels, etc.) could also keep the Fed constrained in its accommodation. Time will tell.
On balance, stronger inflows to gold ETFs in 2025 are a key catalyst that may foreshadow a further and significant bullish run for the yellow metal.
