Bond Losses Create Tax-loss Harvesting Opportunities…Yes, Now
- Today’s higher rates have sent bonds lower on a price return basis, making them ripe for harvest.
- Identify and harvest losses as they occur since investments could bounce back into positive territory.
- Use the wide range of low-cost ETFs to reinvest sale proceeds to reduce costs or reposition portfolios.

Hotter than expected inflation prints over the past few months have tempered expectations for Federal Reserve (Fed) rate cuts. And the Fed’s more hawkish policy stance has pushed rates higher across the curve, with the US 10-year yield increasing by 48 basis points (bps) in April.1
These higher rates have sent core bonds lower; the Bloomberg US Aggregate Bond Index is now down -3.78% for the year on a price return basis, the key indicator for assessing the magnitude of potential tax-loss harvesting opportunities. And over the past three years, core bonds are down -16%, meaning bonds provide tax-loss harvesting opportunities this spring.2
What Is Tax-loss Harvesting?
Harvesting portfolio losses means selling investments in taxable accounts that have lost value to offset capital gains elsewhere and help reduce taxes owed.
When you sell a position that has lost value:
- The loss offsets capital gains from selling securities at a profit during the year, as well as annual capital gain distributions from mutual funds.
- If capital losses exceed gains at year-end (or if there are no gains), losses can offset up to $3,000 in non-investment income, which is often taxed at a higher rate than capital gains.
- You can carry forward losses above $3,000 to offset capital gains and ordinary income over your lifetime.
Higher Rates Across the Curve Set the Stage
With stubborn inflation sparking fears of another wave of price surges, rates rose in unison across the curve in April (Figure 1). The Bloomberg US Aggregate Bond saw the largest one-month change since August 2022, and the sixth-largest in the past 10 years.3 In fact, from the one-year maturity tenor to the 30-year, the rise in rates in April accounted for, on average, 56% of 2024’s rate move.
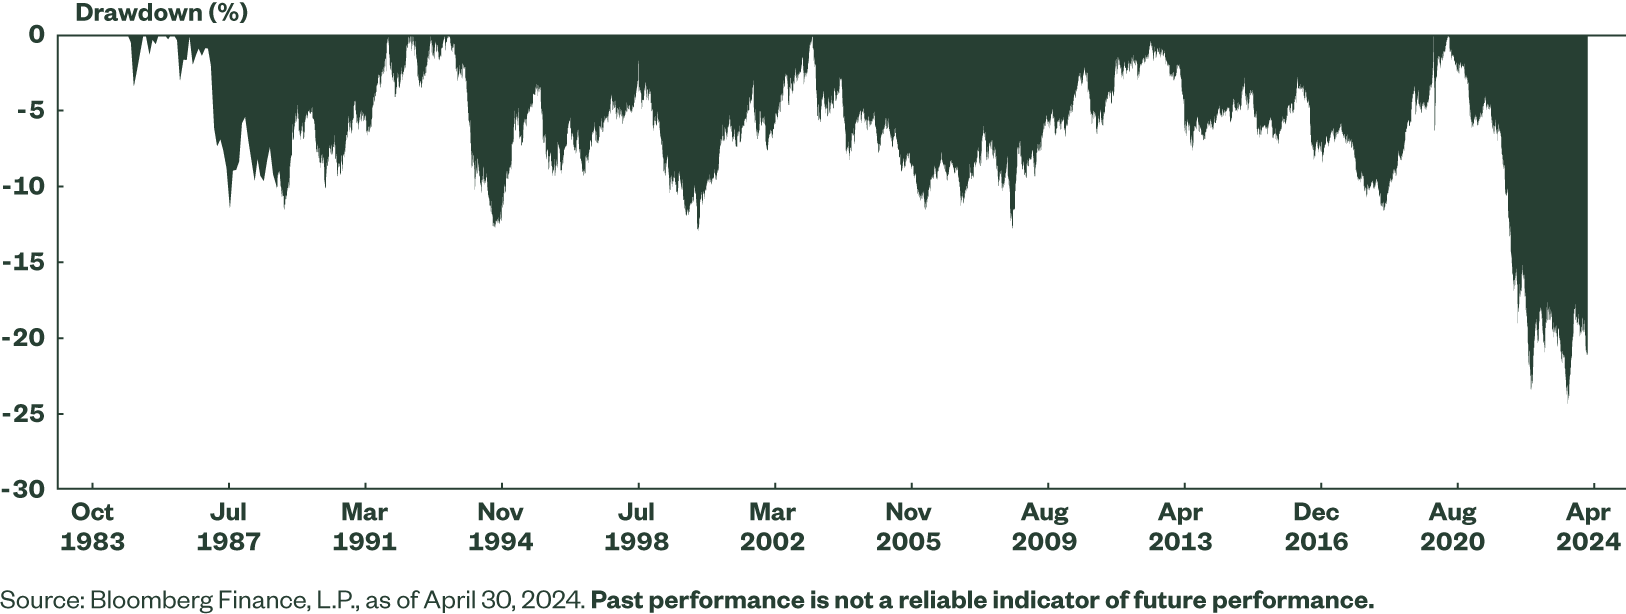
And the Bloomberg US Aggregate Bond Index continues to trade in a massive drawdown (>-20% on a price basis) that is unrivaled by any other period in the past 40 years (Figure 2).
Figure 2: Core Bonds Still in a 20% Max Drawdown
Harvesting With Extensive Capital Underwater
75% of the Aggregate bond funds trading at a loss over the past year have taken in a gross $77 billion of assets.4 But using just two dates to assess losses does not reflect the real world buying behavior or reveal the extent of bond losses from the recent rise in rates.
To estimate bond losses, we created a hypothetical return stream by calculating the price return on an ensemble of ETFs seeking to track the Bloomberg US Aggregate Bond Index — assuming the funds were bought on any day over the past 10 years and sold today.
That lead to 2,532 observations for calculating potential returns, observations that resemble actual investor experiences more than periodic returns (e.g., year-to-date, 1-year, 3-year) that assume only one purchase and sale date. If an investor bought an Agg-based ETF on any of those 2,532 potential purchase dates, the result would be:
- Losses on 2,476 of those days, or 98% of the days in the past 10 years.
- An average loss of -15%.
- 85% of losses greater than -5% and 79% greater -10%.5
Currently, more than $220 billion is invested in funds that can be categorized as a proxy for the broader Agg.6
Bond Losses Extend Beyond the Agg
Bigger picture, there are 684 bond ETFs trading today, covering core bonds, investment-grade credit, high yield corporates, and emerging market debt, as well as hybrids like convertibles and preferreds. Of that group, 563 have at least one year of returns. And of the 563 bond ETFs with a one-year record and $80 billion of gross inflows so far this year,7 80% are trading at a loss year to date. Over the past year, 66% have had losses.8
Non-traditional bond sectors and those with inflation protection built in have performed better than traditional and nominal bond markets (Figure 3). And over the past year, given the trends in credit, the more credit-sensitive sectors have fared better than the pure rate sensitive markets (e.g., government bonds, investment grade corporates, and Aggregate exposures).
Harvest, then Swap to Reposition or Lower Costs
When harvesting losses, don’t forget that the IRS’ Wash-sale Rule prohibits claiming a loss on the sale of an investment if the same or “substantially identical” investment is purchased either 30 days before or after the sale date. A “tax swap” can serve either as a placeholder to maintain exposure to the asset class for 30 days before switching back to the original holding or a more permanent replacement to reposition portfolios for the longer term by:
- Refining Portfolio Exposures: Tax swaps enable you to invest proceeds from the sale to target new markets. You could sell a passive fund and invest proceeds into an active strategy that’s potentially more suitable to navigate today’s complex macro risks. Or you could sell a broad-based sector fund and invest in a more specific sub-bond sector ETF.
- Lowering Portfolio Costs: Replacing higher-fee mutual funds with low-cost core bond ETFs may help you build more cost-efficient portfolios while retaining asset class exposure. Expense ratios for our low-cost SPDR® Portfolio ETFs™ are 95% lower than the median US-listed mutual fund.9
Check out our Morningstar Fund Comparison Tool to help you evaluate specific mutual funds and ETFs. And keep pace with this challenging market with our market trends and featured insights.