2024 Target Retirement Annual Review
Each year, State Street Global Advisors conducts a comprehensive review of its Target Retirement strategies. The annual review process is driven by the Defined Contribution Investment Group (DCIG), which blends asset allocation expertise from State Street’s Investment Solutions Group with defined contribution (DC) market insights from the Global Defined Contribution team. The review follows a consistent and transparent framework to reassess the capital market expectations and demographic assumptions that underpin the glidepath, while also evaluating new asset classes and investment themes for inclusion in the portfolios. The process is grounded in three key criteria: desirability, suitability, and investability.
As we approach the 20th anniversary of our Target Retirement strategies, this framework has driven constant evolution and adaptation – improving efficiency and key risk management via an expanded opportunity set and thoughtful index selection. While no new asset classes met the criteria for inclusion in 2024, our review touched on two key aspects of our process – continued refinement to address evolving market structure, and focus on investability via index selection.
Executive Summary
US Small/Mid Cap: Adapting to Evolving Markets
The State Street Target Retirement strategies follow a long-term, strategic approach. A granular set of index-based building blocks allow for thoughtful and intentional alignment of portfolio characteristics with participant time horizons and objectives. Focusing on our US Equity allocation, this translates to a strategic overweight to US Small/Mid-Cap (“US SMID”) stocks for participants with longer time horizons, which is gradually reduced over time as participant objectives shift from accumulation to preservation. US Large Cap stocks have delivered over a decade of strong outperformance, driving a shift in market structure. These evolving dynamics merit a refresh of the case for US SMID, as well as a recalibration of the relative weights to a more current definition of market cap weighting.
Our evaluation of small/mid cap exposures focused on two key areas:
- Reviewing the long-term risk premia associated with small and mid-cap stocks and whether we expect this to persist.
- Assuming the risk premia is reinforced, confirming the appropriate neutral market cap weights from which to anchor our relative over and underweights.
Through this work we reaffirmed our conviction in the long-term expected risk premia of US SMID – in other words, higher return in exchange for higher risk – leading to the conclusion that our emphasis at each point in the glidepath remains appropriate.
However, given the persistent nature of the market shift and mixed market dynamics, we will adjust the portfolios to reflect a more current neutral market weight for US Equities – increasing the neutral US Large Cap allocation from 80% to 85%, and reducing the neutral US SMID weight from 20% to 15%. This updated neutral weight is in line with the five-year moving average for each asset class. Given our reaffirmed conviction in the long-term risk premia of US SMID, this reallocation represents a mark-to-market exercise to bring our views in-line with the shift in the US equity market.
Result: Updating allocations to US Small-Mid Cap equities throughout the glidepath to align with intended strategic over and underweight.
New Commodities Benchmark: Improved Precision, Better Inflation Protection, and a New Allocation for the Mutual Funds
We have long held the belief that commodities are an appropriate strategic allocation for participants approaching retirement, as they offer diversification and the potential to mitigate the risk of rising or unexpected inflation. Index selection is crucial to delivering the preferred risk and return characteristics while addressing negative roll-yield often associated with passive commodities investing. Our focus on index selection led us to first establish commodities in the glidepath via the Bloomberg Roll Select Commodity Index in 2012. Roll Select is a rules-based version of the Bloomberg Commodity Index that aims to mitigate the effects of contango on index performance. A third-generation version of this benchmark, the Bloomberg Enhanced Roll Yield Index (BERY), provides more diversification and increased focus on roll yield – both of which have resulted in improved risk-adjusted returns and a higher sensitivity to inflation over the current benchmark. Finally, the ability to use a low-cost ETF to track this benchmark allows the mutual fund vehicle of the SSGA Target Retirement strategies to invest in commodities – better aligning our product offerings around our best thinking.
Result: Change benchmark for Commodities exposure from Bloomberg Roll Select Commodity Index to Bloomberg Enhanced Roll Yield (BERY) Commodity Index. Establish exposure to Commodities in TDF Mutual Fund series.
In this paper, we will provide insights into our research process and some of the key considerations that drove these recommendations through the lens of our three key criteria: desirability, suitability, and investability.
US Small/Mid Cap
Desirability
Evaluating an asset class through the lens of desirability focuses on two key questions -- does the asset class improve risk adjusted returns or better address key investment risks?
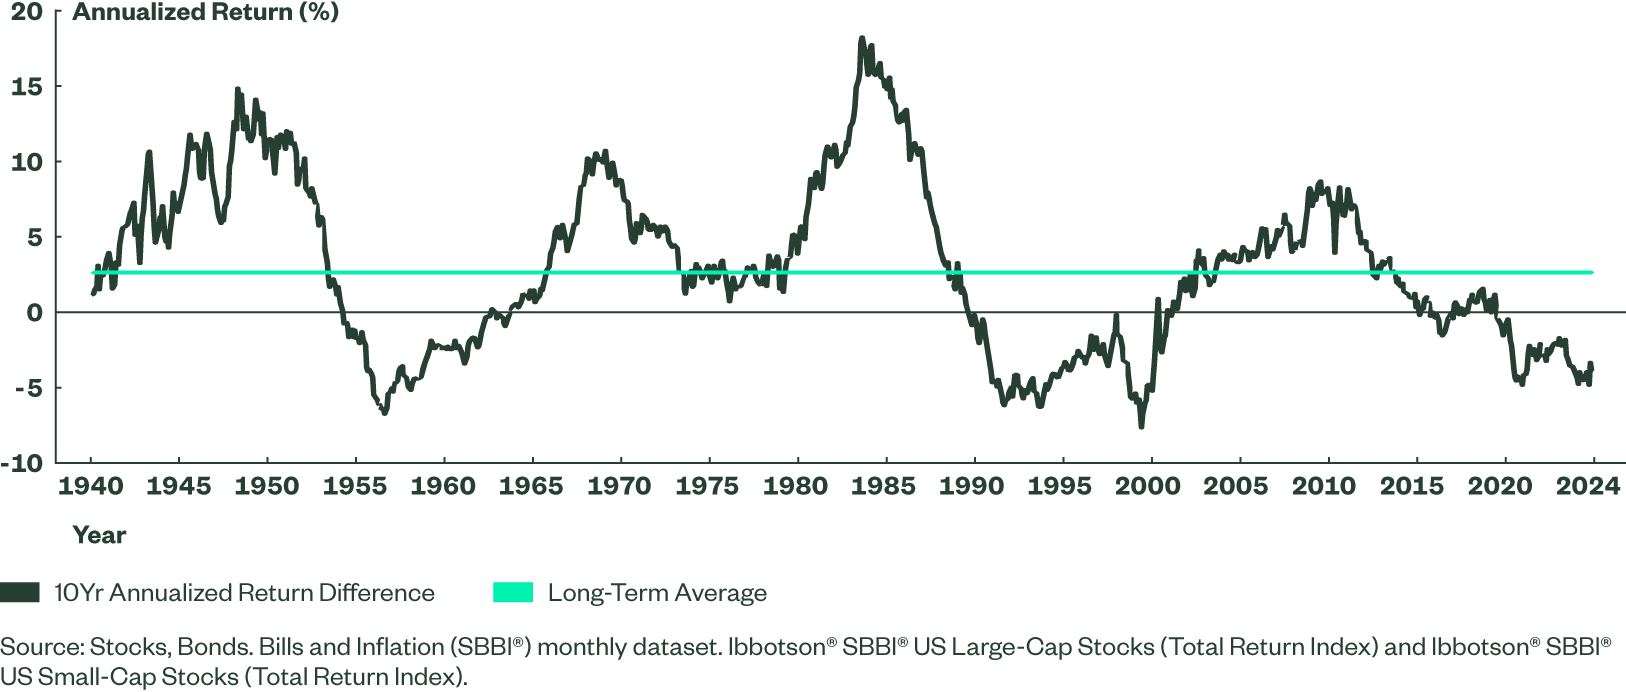
The case for overweighting US SMID early in the glidepath does not rely on an assumption around improved risk-adjusted returns – which certainly existed at times historically but has eroded in recent decades – rather the goal is to provide higher absolute returns. While not necessarily more efficient on a standalone basis than large cap equivalents, the higher long-term return and higher risk expectations for US SMID better align with the objectives for younger participants who are focused on wealth accumulation and can withstand additional volatility. Long windows of historical data shows that smaller companies tend to outperform larger companies in absolute terms.
Figure 1: Small Companies Have Outpaced Large Companies over the Long-Term

This relationship has flipped over the last decade, though, as large caps have outperformed US SMID by over 300 basis points annually over the period. While US SMID companies have bounced back somewhat as of the time of this writing — and even ten-years is a relatively small sample in the context of a participant’s career — this is a long enough trend to justify further exploration of the drivers of underperformance.
Digging deeper into current market dynamics, there are a number of potential trends — both positive and negative — that may impact the future outlook for US SMID. The increasing prevalence of private markets, for example, has caused more companies to stay private longer, leading to either IPOs as large companies or acquisition by mega-cap companies rather than go public earlier in their lifecycle. Further, public small cap companies are particularly sensitive to interest rates, and greater reliance on bank funding has led to increases in the cost of borrowing. In more positive news, some of the trends we’ve seen that have bolstered large caps — namely, the development and deployment of AI — may start to move down the market cap spectrum and be more conducive to SMID companies (e.g., energy and infrastructure). More importantly, the current secular bear market in small caps relative to large is the longest on record, and concentration in mega caps, paired with a reasonable assumption of long-term mean reversion in PE ratios across asset classes suggest potential tailwinds for the longer-term prospects for SMID companies.
Our long-term asset class forecasts, capturing evolution in market dynamics over time, suggest a 40 basis point annual return premium for SMID stocks relative to large caps. While we seek to be conservative in our assumptions, higher dividend yields, real-earnings growth and the potential for PE reversion support the case for long-term higher returns from US SMID.
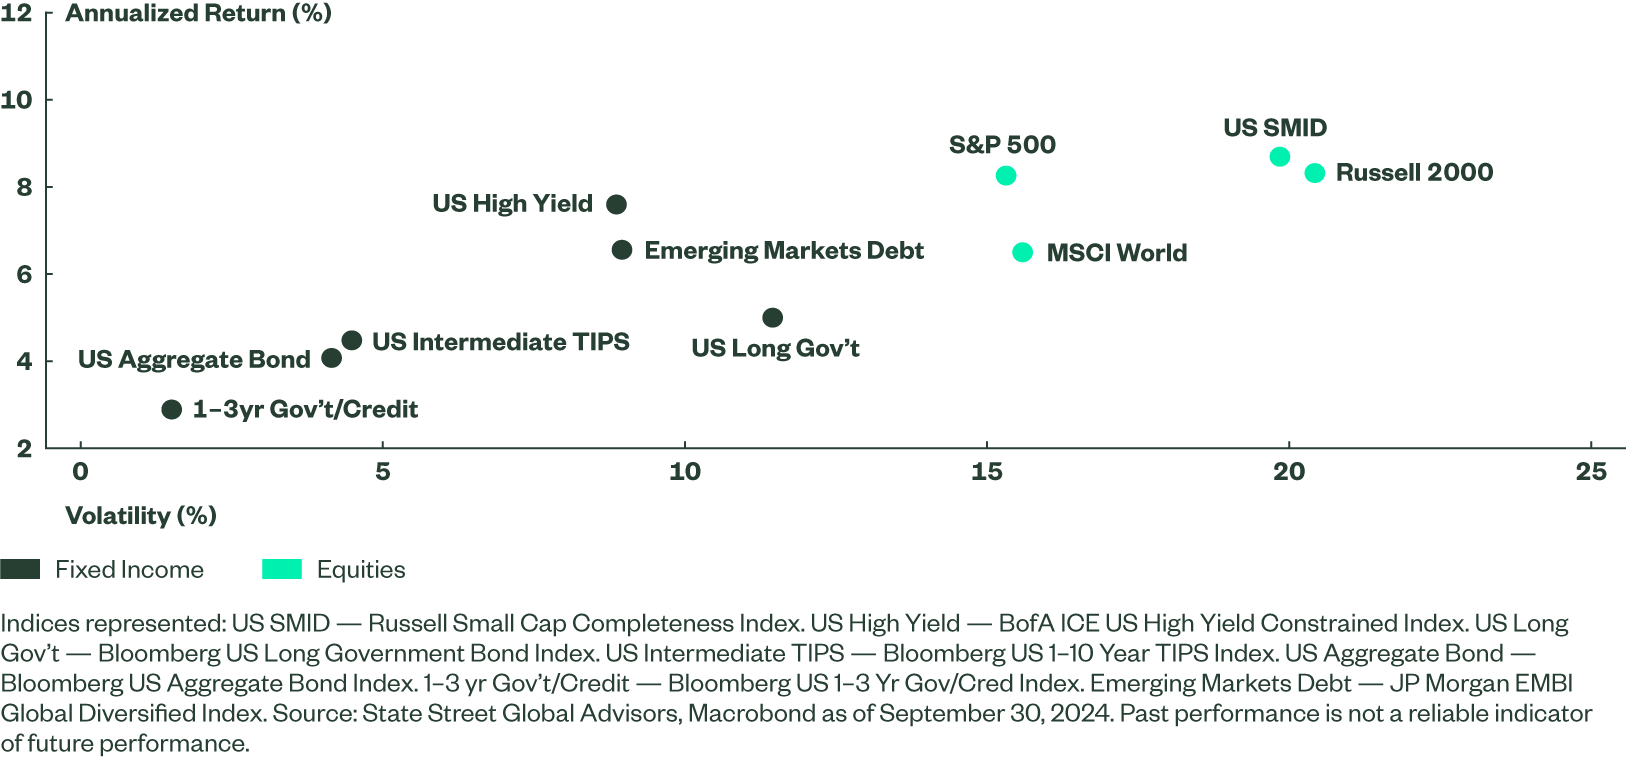
However, it is important to separate the driver of this expectation. The Russell Small Cap Completeness index, our preferred method of implementation, has historically exhibited a beta of approximately 1.1 relative to the S&P 500. Over the past 25 years, US SMID outperformed US Large Caps by 44 basis points annually, with roughly 450 bps higher annualized risk.
Figure 2: Despite Recent Sample, SMID has delivered higher returns with higher risk

Looking at this longer sample, and supported by our future outlook, US SMID still exhibits a risk premium relative to US large caps over the long-time horizons that Target Date funds are built to address. As such, overweighting US small and mid caps is appropriate early in the glidepath to align with these longer time horizons. However, as US large caps have grown to make up a larger percentage of the US total market, we are recalibrating our strategic weights to a new market neutral weighting of 85% Large Caps/15% Small-Mid Caps. This is an appropriate step to ensure that participants are not holding a higher weight to SMID than intended – especially important for those participants near retirement where the risk profile of the asset class is less desirable. For more on this methodology, we shift our focus to suitability.
Suitability
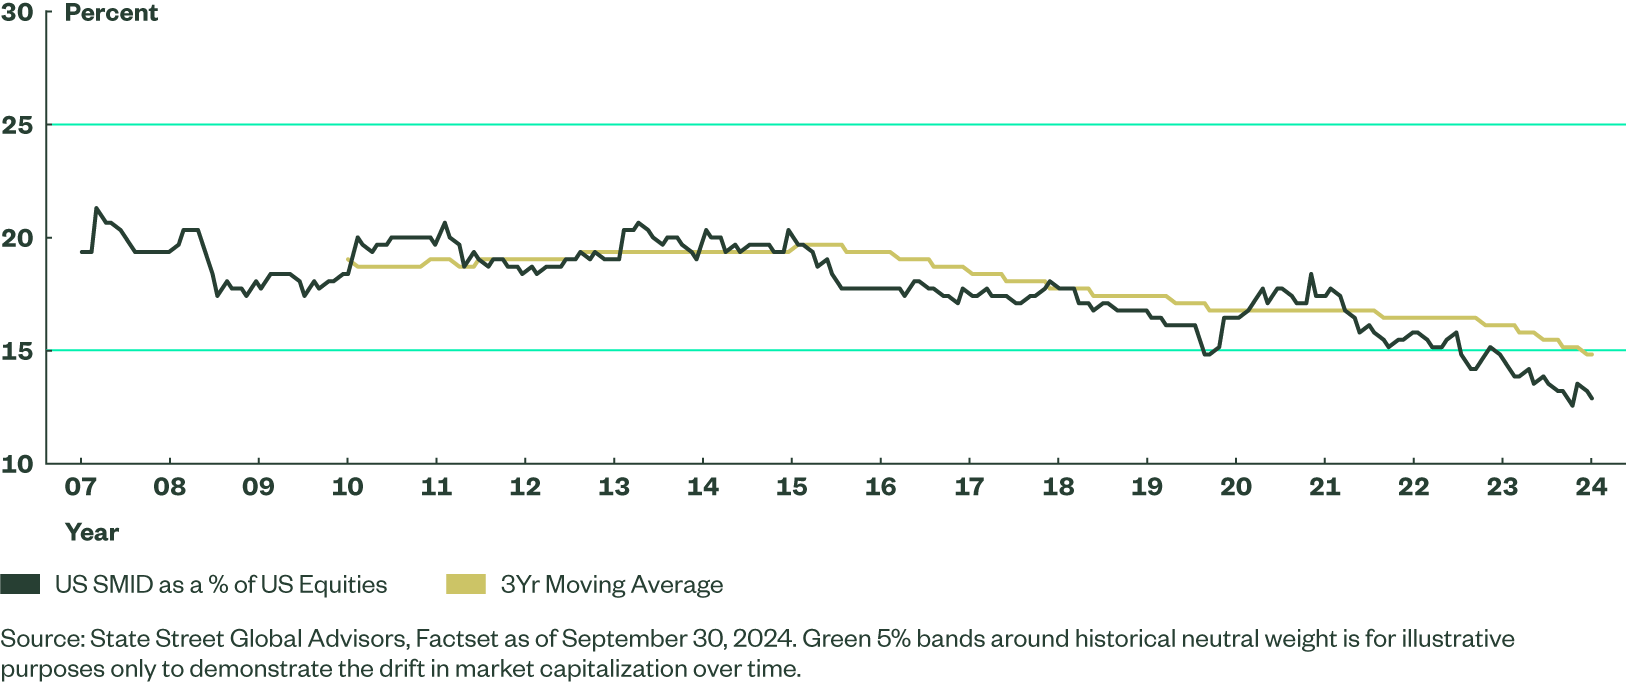
While a higher allocation to US SMID stocks may be appropriate for younger participants, this becomes less appropriate as participants age. The long-term average percentage of the US Equity market made up by SMID has been approximately 20%.
But, outperformance from US Large Cap stocks has led to a drift in market composition that is significant and, for the first time, has persisted for a long enough period to impact moving averages over the trailing three, five and, to a lesser extent, ten-year period. As a result, based on a moving average of market cap weighting, our strategic rebalancing policy – designed to keep these relative weights consistent over time -- has led to an outsized overweight to SMID for younger participants while also potentially creating a modest, unintended overweight for participants in retirement.
Below, we illustrate the historical weight of US Small/Mid Cap stocks as a percentage of US equity markets. Despite some volatility, this allocation has generally held around 20% until the last decade. Outperformance of large cap over the last decade has caused a steady drift, and the last few years (after a mean reversion during COVID) has compounded this trend, leading to what we view as a persistent shift in the appropriate reference point. As the chart illustrates, the 3-year moving average market cap has breached a 5% band, suggesting a meaningful and persistent shift that justifies further evaluation.
Figure 3: US SMID Has Decreased as a Percentage of US Equities

Our Mosaic Framework
The State Street Target Retirement strategies are managed through a long-term strategic process, and the importance of constant evaluation must be balanced with our mandate to avoid tactical decisions. We analyze the need to make changes by pairing point-in-time analysis with a moving average of market cap weighting.
Considering longer-term moving averages provides a level of stability as we look for persistent trends in analyzing the need to adapt to market dislocations. From a quantitative perspective, we believe monitoring market dynamics within an allowable range provides clear guidance as to whether further analysis is warranted. From there, we layer in qualitative analysis, evaluating the desire to adhere to strategic targets (updating the allocations to align with today’s market structure) with the objective of delivering successful retirement outcomes.
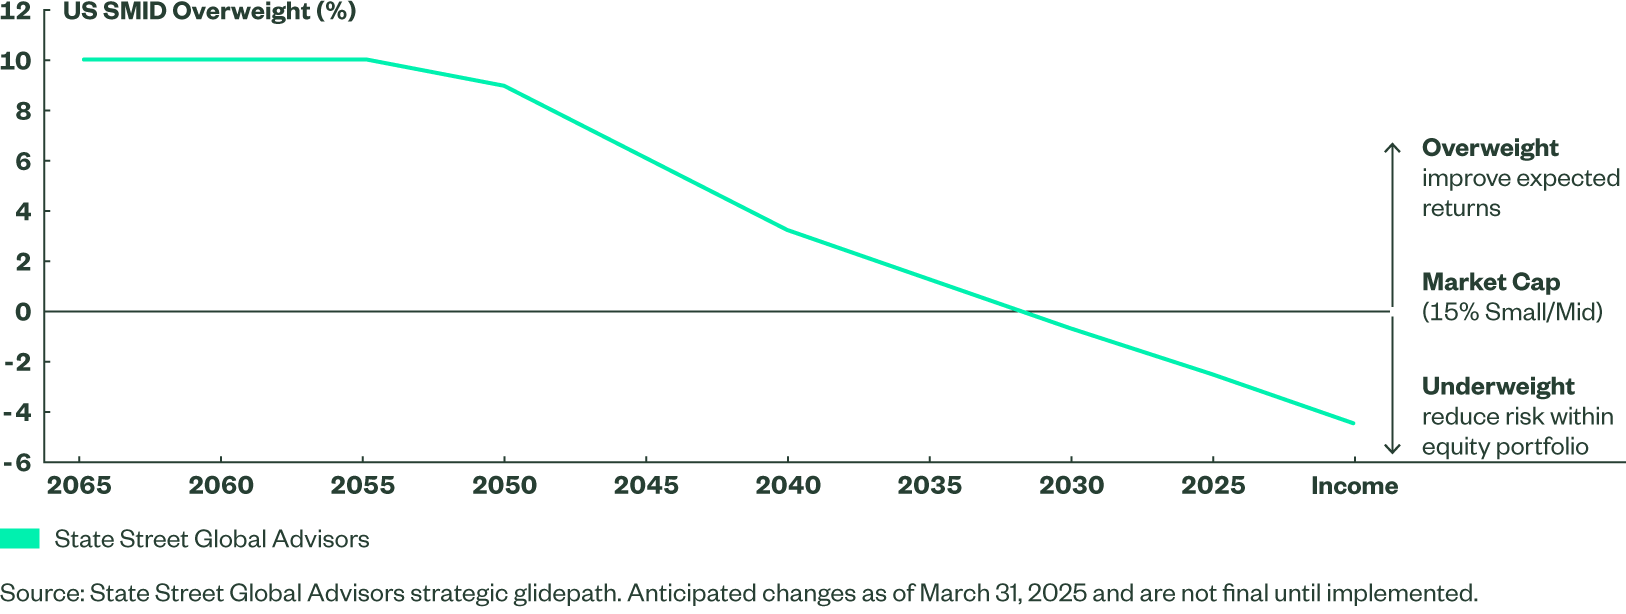
In this case, our long-term conviction in US SMID, paired with the desire to deliver appropriate risk levels across the glidepath, resulted in a housekeeping exercise to clean up the SMID cap relative weights. Specifically, the neutral weight around which we assign over and underweights will be 85% large cap / 15% SMID. While the magnitude of our strategic over and underweights across the glidepath remain unchanged, we will update the allocations to reference this new neutral weight. The result is a modest reduction in US SMID ranging from 3% in the 2070 fund to 1% in the Retirement vintage.
An interesting point of comparison for this analysis is the relative size of US markets in the global market capitalization. US Equities make up 57.5% of the equity allocation in our longest dated vintages and 60% of equity in retirement. This represents a slight home bias relative to a historical view of market cap weighting, and the 57.5% starting allocation was in line with market cap weighting at the time of our last glidepath change in 2020. However, the aforementioned decade of dominance from US Large Cap stocks has caused the US to grow to an outsized weight, and this trend has accelerated more recently. While the US makes up roughly 64% of market capitalization today, this is a new trend and not supported by a longer-term view of moving averages. We will continue to monitor this split using the same framework that we use for our US Equity allocation, and will commit to further analysis if this trend persists.
Investability
Consistent with our philosophy as an index-based manager, we seek to deliver total-market, style-neutral exposure to markets as efficiently as possible. Pairing the Russell Small Cap Completeness Index with the S&P 500 provides broad exposure to US Equity markets, with methodology that intentionally eliminates gaps and overlaps in coverage. More detail on our approach can be found here.
Commodities Benchmark Review
Additionally, we focus our investability review on Commodities exposure across our Target Retirement Strategies. Commodities offer potential diversification benefits when added to portfolios of equities and fixed income. They can also help mitigate the risk of rising or unexpected inflation as commodities are closely linked with the real economy and reprice quickly. While index selection is important in any asset class, selecting the right benchmark is an especially important part of Commodity investing.
Since 2012, our commodity index offering used the Bloomberg Roll Select Commodity Index (BCOMRS) strategy. BCOMRS is a dynamic version of the Bloomberg Commodity Index (BCOM) that aims to mitigate the effects of contango on index performance. At each monthly roll period for each commodity, BCOMRS follows a transparent, rules-based process whereby it rolls into the futures contract showing either the most backwardation or least contango, selecting from those contracts with nine months or fewer until expiration. Roll yields (the returns generated when an open contract is “rolled” to a future with a longer dated expiry) can be meaningful in commodity investing. BCOMRS, with its optimized contract selection, has outperformed the first-generation index by 99 bps annually over the last ten years.
The Bloomberg Enhanced Roll Yield Index (“BERY”) is a third-generation version of the Bloomberg Commodity indices that seeks to improve on this methodology. BERY follows a transparent, rules-based process and offers a more stable and diversified roll return profile. The BERY index combines four key aspects that we believe create a more desirable exposure:
- Liquidity based weights address capacity concerns and increase exposure to the most economically relevant commodities, potentially better harvesting curve and carry premium.
- Diversification via curve premium (allocation to multiple contracts) is a key driver of long-term performance.
- Tilting of individual commodities weights based on slope differentials (“slope score”), consistent with the objective of providing exposure to commodities that trade in backwardation.
- Continuity from annually rebalanced weights.
During the construction of the BERY index, liquidity percentages are determined per individual commodity and these weights are subject to similar diversification requirements as BCOMRS, including capping single commodities at 15% and groups/sectors of commodities at 33%. “Slope scores” are then determined and scaled with the degree of backwardation relative to other commodities. Commodities with higher liquidity and a higher degree of backwardation are given greater target weights.
To harvest the curve premium, the BERY index typically allocates to the front (nearest expirations) four futures contracts for each commodity (gold and silver use three contracts) where liquidity is the deepest at equal-weights. The index rebalances these contracts back to equal-weights on a monthly basis. The roll period for BERY is ten days, twice as long as BCOMRS as BERY seeks to reduce roll congestion and the sensitivity to short-lived price shocks. During the monthly roll period for BCOMRS, one contract per commodity showing the most backwardation is selected. By holding one contract, BCOMRS offers less protection against the volatility in the curve dynamics of commodity futures. In a sharp price movement in a commodity, the front of the curve experiences a more dramatic movement than those contracts further out on the curve where BCOMRS could be positioned.
Figure 4: Characteristics are Similar between BERY and BCOMRS
| Bloomberg Commodity Roll Select Index | Bloomberg Enhanced Roll Yield Index | |
|---|---|---|
| Rebalance | Annual January Roll Period (6th to 10th Business Day) | Annual January Roll Period (1st to 10th Business Day) |
| Composition | 24 commodity future contracts | 26 commodity future contracts |
| Target Weights | 2/3 Liquidity 1/3 World Production Liquidity - 5 yr. Average Dollar Value Traded Production – 5 yr. Average production, adjusted by USD | Liquidity and Slope Score Adjustment Liquidity - 3 yr. Average Dollar Value Traded Slope Score – Carry Premium Adjustment |
| Constraints | No Single Commodity can exceed 15% No related group/sector of commodities may constitute more than 33% of the index No single commodity, together with its derivatives, may constitute more than 25% of the Index | No Single Commodity can exceed 15% No related group/sector of commodities may constitute more than 33% of the Index No single commodity may constitute less than 1.5% of the Index as liquidity allows |
| Roll Period | 6th to 10th Business Day | 1st to 10th Business Day |
| Contract Calendar | Monthly contract selection choosing the most backwardation contract within nine months (where liquidity is present). | 3 to 4 Futures Contract per commodity* Monthly (equal weighted) |
Source: Bloomberg Finance LP, State Street Global Advisors as of 9/30/2024, * Gold and Silver use three contracts
While a small sample, the enhanced roll methodology and additional diversification within the BERY index has resulted in less volatility and improved risk-adjusted returns compared to BCOMRS. BERY has also demonstrated a higher sensitivity to inflation.
Figure 5: BERY Has offered Improved Efficiency and Sensitivity to Inflation
| Bloomberg Commodity Roll Select Total Return Index | Bloomberg Enhanced Roll Yield Total Return Index | |
| Annualized Return (%) | 5.29 | 8.71 |
| Standard Deviation (%) | 14.03 | 13.16 |
| Sharpe Ratio | 0.28 | 0.56 |
| Maximum Drawdown (%) | -22.19 | -16.09 |
| Beta to CPI-U* | 1.49 | 1.71 |
Source: Bloomberg Finance L.P, Factset, State Street Global Advisors as of 09/30/2024. *Consumer Price Index for All Urban Consumers (CPI-U) with base of 1982-1984= 100. Indices are unmanaged, are not subject to fees and expenses, and are not available for direct investment. Past performance is not a guarantee of future results.
Selecting the right benchmark is important in commodity index investing. Roll yields play an integral role in commodity returns. In our view, the Bloomberg Enhanced Roll Yield Index methodology provides greater exposure to commodities trading in backwardation, improved diversification via the curve premium as well as higher sensitivity to inflation. The Index also provides high capacity which is essential for Target Retirement strategies.
New Asset Class for the Mutual Fund Vehicle
Due to the lack of a low-cost ETF or mutual fund vehicle, the mutual fund series of our Target Retirement strategies has not historically held exposure to commodities. Instead, this allocation is reallocated back to equities in the mutual fund series.
With the switch to the new benchmark (BERY), there are low-cost ETFs available to track this benchmark, and we are pleased to introduce commodities to our TDF mutual fund series. The allocation will be taken from equity exposure starting at age 60 (mirroring the CIT glidepath), and will provide for more robust and diversified inflation protection for those near and in retirement.
Conclusion
While Target Date funds are intended to be ‘set it and forget it’ investments for plan participants, this logic certainly does not apply to our process for overseeing the solutions. Constantly monitoring the glidepath to ensure it appropriately addresses key investment risks, while anchored by a long-term framework, strikes a balance between responsiveness and over-trading. The result of this year’s review is modest – a 3% trade from US SMID to US Large Caps in the 2070 fund and a 1% trade in the Retirement vintage – but is important housekeeping to ensure that the underlying asset classes are being utilized as intended. We will continue to monitor both the US and Non-US equity allocation through this framework and are committed to similar housekeeping exercises if relative weights meaningfully deviate from strategic intent. Further, index-selection is an often overlooked aspect of index-based target retirement strategies. The evolution of our Commodity exposure and alignment across vehicles reflects our commitment to improving outcomes through strategic asset allocation and thoughtful implementation.
Figure 6: Updated Glidepath Allocation to Small/Mid Cap Using 15% Neutral Weight
