Comparing SPY and SPLG: Two SPDR ETFs for S&P 500® Exposure
Investors seeking to diversify portfolios and capture market returns often begin with the S&P 500® Index — a well-known index that offers access to 500 of the largest publicly traded US companies.1
For more than 30 years, investors have relied on the first US-listed ETF, the SPDR® S&P 500® ETF (SPY), for efficient and highly liquid access to the total return of the S&P 500 Index. Rebranded in 2020, the SPDR Portfolio S&P 500® ETF (SPLG) also tracks the well-respected index, but for just 2 basis points (bps).
That means investors seeking exposure to the S&P 500 Index can choose between two SPDR ETFs based on their specific investment style and priorities.
Figure 1: Two SPDR ETFs Offer S&P 500® Exposure
| Ticker | Name | Expense Ratio (%) | Regulatory Structure | AUM ($B) | Share Price ($) | 30-day Average Spread ($) | 30-day Average Spread (%) |
|---|---|---|---|---|---|---|---|
| SPY | SPDR S&P 500 ETF | 0.0945 | Unit Investment Trust (UIT) | 527.5 | 519.26 | 0.01 | 0.002 |
| SPLG | SPDR Portfolio S&P 500 ETF | 0.02 | Open End Fund | 33 | 61.07 | 0.01 | 0.0164 |
Source: State Street Global Advisors, as of April 3, 2024.
SPY: The Original S&P 500 ETF
SPY, the SPDR® S&P 500® ETF Trust, democratized investing and set the ETF market in motion. Since its launch more than 30 years ago, it has been a key player in the ETF industry, offering investors:
- Record Liquidity: SPY is the world’s most traded ETF — trading $38.3 billion a day, on average — giving investors the ability to tap unmatched liquidity and portfolio flexibility to implement sophisticated trading strategies.2
- An Established Track Record: SPY has closely tracked the performance of the S&P 500® Index for 30-plus years. Investors value this consistency, especially when aiming to capture broad market movements.
- Lower Trading Costs: While SPY has a slightly higher expense ratio than other S&P 500® ETFs, its liquidity and tight bid-ask spreads often result in lower overall trading costs, especially for frequent traders.3
What Can You Do with SPY?

What Can You Do with SPY?
The possibilities are nearly endless when you invest in the world’s most traded ETF.4
SPLG: A Cost-Effective Option
SPLG, the SPDR® Portfolio S&P 500® ETF, offers investors a cost-effective solution for seeking exposure to the S&P 500 Index. With the recent focus on low-cost ETFs, SPLG has gained traction among investors looking to reduce their investment expenses due to its:
- Low 2 bps Expense Ratio: Compared to other S&P 500® ETFs, SPLG boasts a significantly lower 2 bps expense ratio — which may translate to substantial savings over the long-term for cost-conscious investors.5
- Reliable, Broad Market Exposure: Like SPY, SPLG provides exposure to the entire S&P 500® Index, allowing investors to capture the performance of the largest US companies across various sectors.
- Part of a $200B Product Suite: SPLG is just one of the funds within our suite of low-cost SPDR® Portfolio ETFsTM, which recently hit $200B in AUM.6
How Do You Choose Between SPY and SPLG?
Big picture, SPY delivers the liquidity that supports trading efficiencies and optionality. And SPLG’s lower expense ratio may make it more attractive for longer-term allocations and smaller-sized accounts.
To determine which fund is better suited for your objectives, ask yourself:
- How frequently do I trade?
- What’s my holding period?
Evaluate Your Trading Frequency
The costs of owning an ETF extend beyond just the expense ratio. Two primary components make up the total cost of ownership (TCO) of an ETF: trading costs and holding costs.
The more you trade, the greater emphasis you should place on the trading cost component of an ETF’s TCO. If you trade frequently, an ETF’s bid-ask spread can influence the TCO more than the expense ratio. So, do you rebalance monthly? Quarterly? Annually?
Figure 2: Two Key Components of an ETF’s TCO

Both SPY and SPLG trade, on average, with a $0.01 wide bid-ask spread. However, SPY’s higher share price means its spread is narrower in percentage terms versus SPLG, making trading more cost efficient in terms of basis points (0.002% for SPY and 0.0164% for SPLG).
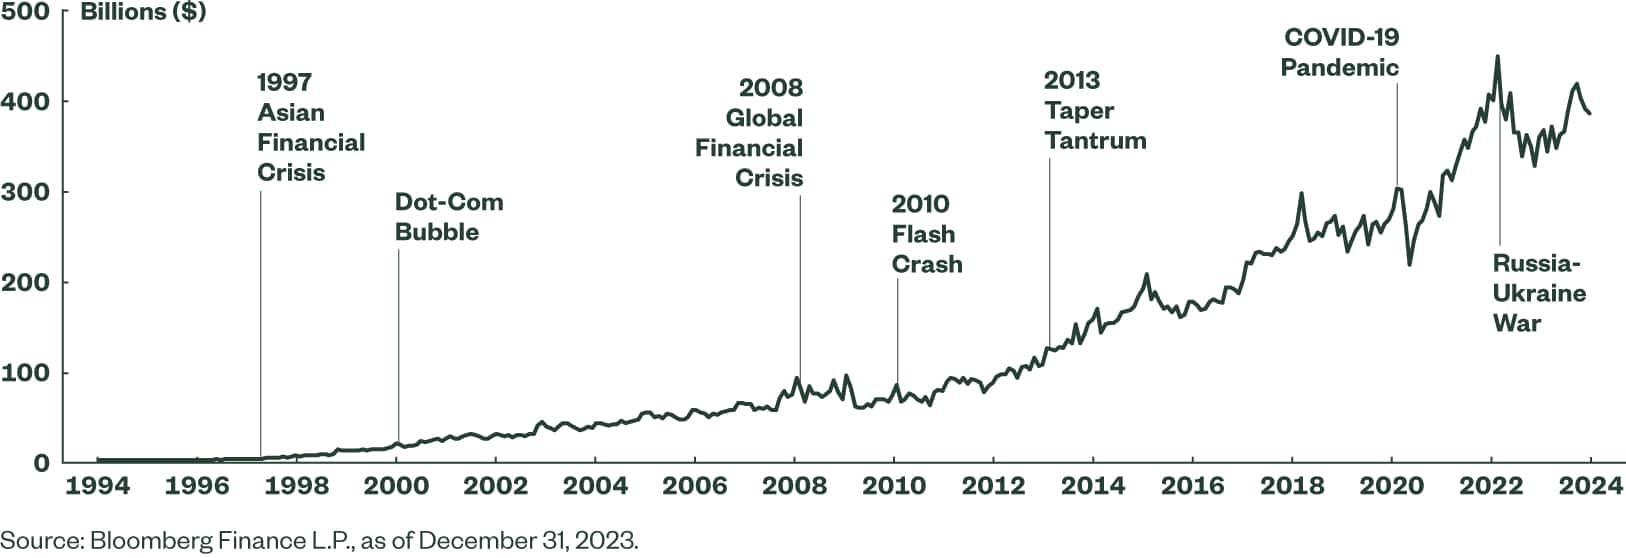
More importantly for frequent traders, as the industry’s liquidity leader, SPY’s spread remains consistent — even when volatility strikes. As the market began to witness steep declines during the onset of COVID-19, for example, SPY traded $53 billion, on average, during February and March 2020 while maintaining a bid-ask spread below 1 bps.7 SPY’s consistent spread, together with its large notional value traded, supports a wide array of execution types.
And on top of this, SPY became the first ETF to trade more than $100 billion in a single day on February 28, 2020,8 showing that investors gravitate to its deep pool of liquidity — particularly when liquidity is needed most.
Figure 3: SPY Has Helped Investors Navigate Volatile Periods
SPY Assets Since 1993

Analyze Your Holding Period
Time should also play a role in your product selection. In other words, ask yourself if your S&P 500® allocation is a short-term tactical or buy-and-hold position.
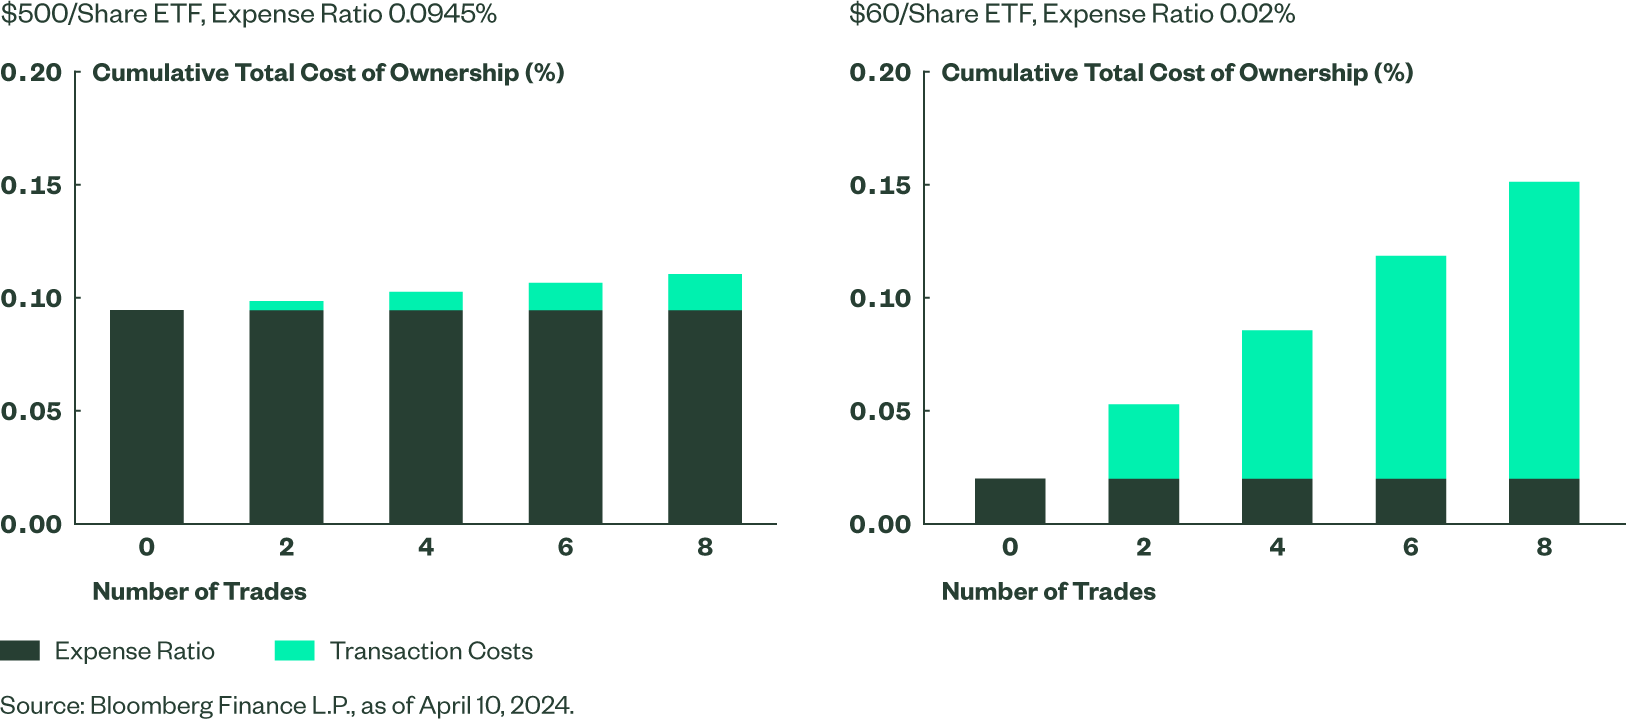
Shorter Time Horizon? Choose SPY’s Lower Transaction Costs
Let’s say you are a tactical investor who trades 50% of your position periodically over the course of a year. Although two hypothetical ETFs may have the same $0.01 bid-ask spread, the TCO will vary between an ETF at $500/share with an expense ratio of 0.0945% and an ETF at $60/share with an expense ratio of 0.02%.
Assuming no change in market price, and no additional tracking difference between these two funds, you would pay less in total cost with the ETF with the higher expense ratio due to its more cost-efficient secondary market (Figure 4).
Figure 4: When to Prioritize Lower Transaction Costs

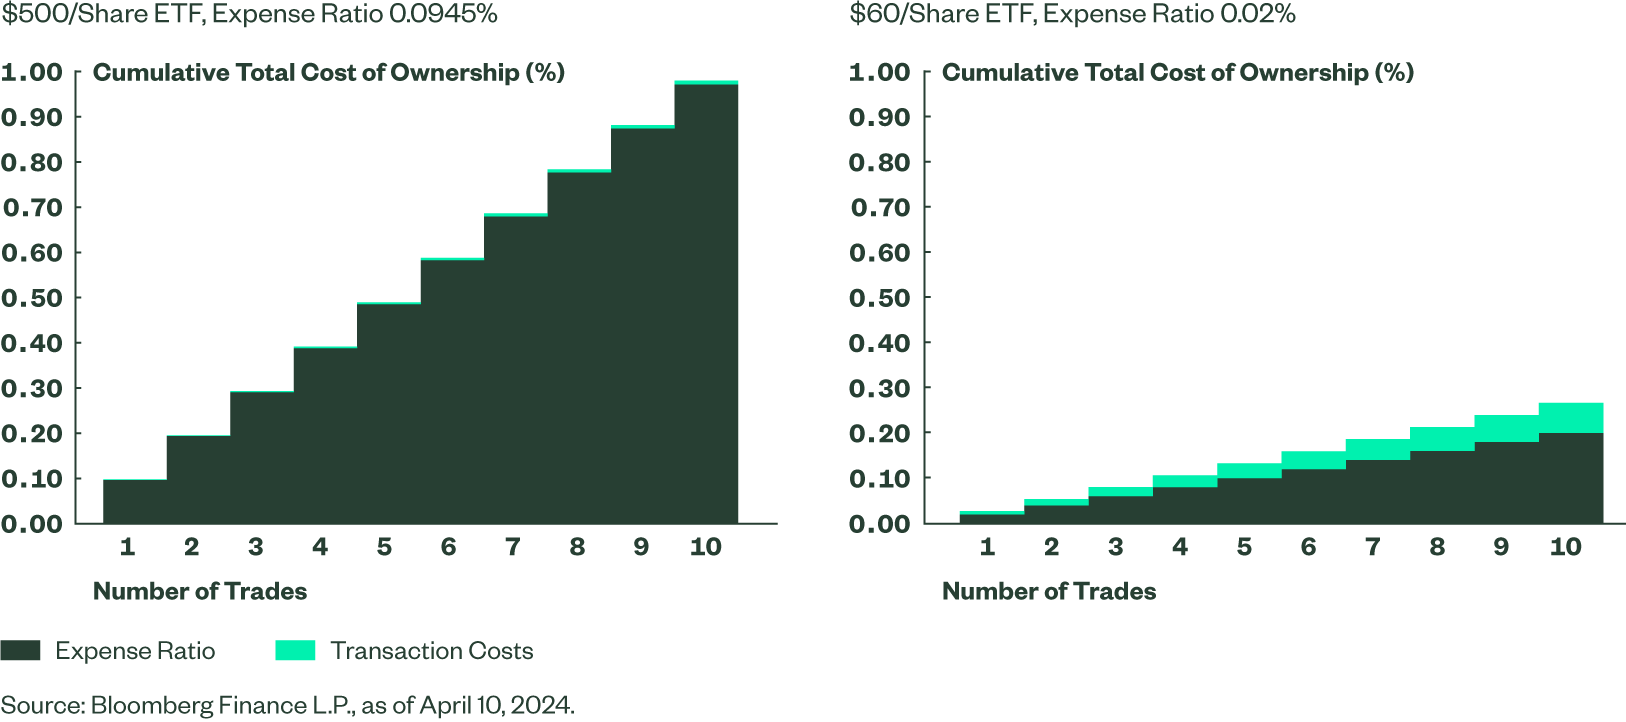
Longer Time Horizon? Choose SPLG’s Lower Expense Ratio
Alternatively, you might have a 10-year time horizon and rebalance 10% of your position quarterly. If we assess the total cost of ownership between the same ETF at $500/share with an expense ratio of 0.0945% and an ETF at $60/share with an expense ratio of 0.02% where both funds trade with $0.01 bid-ask spread — again, assuming no change in market price, and no additional tracking difference between these two funds — you would pay less in total cost with the lower priced ETF, despite greater transaction costs.
Figure 5: When to Prioritize a Lower Expense Ratio

The Final Verdict: It Depends on Your Needs
Which fund nets out as the clear winner? It’s not clear cut. Your unique investment needs and objectives determine the winner.
Of course, it doesn’t have to be either/or with SPY and SPLG.
Depending on your priorities and investment style, a combination of these funds may help you reach your goals even more efficiently. Factors that may make a combination of these two ETFs suitable include your tax situations, fee budgets, and tactical strategies, among others.

SPY
NAV
The market value of a mutual fund's or ETFs total assets, minus liabilities, divided by the number of shares outstanding.
$567.07
as of Mar 27 2025
$587,810.13 M
as of Mar 27 2025
SPLG
NAV
The market value of a mutual fund's or ETFs total assets, minus liabilities, divided by the number of shares outstanding.
$66.91
as of Mar 27 2025
$60,389.05 M
as of Mar 27 2025