What Portfolio Analysis Reveals About Investor Behavior
Plenty of bad news could have disrupted markets in 2023 — hawkish policy from the Federal Reserve (Fed) and other global central banks, decreasing but still high inflation, earnings recession, and increasing geopolitical tensions. Instead, the stock market rallied and the US economy expanded, supported by a strong labor market.
The SPDR Americas Research Team analyzed close to 500 client portfolios to gain insight into how investors behaved and adjusted their portfolios against this backdrop.


The SPDR Americas Research Team compared the portfolio allocations of 2022 and 2023 to their respective strategic benchmarks using the team’s Portfolio Insights Analysis.
This analysis evaluates the asset classes, security types, sectors, and duration of a portfolio to identify its exposures and any potential risks that may have been overlooked.
So, how did clients adjust allocations in 2023? Seven trends emerged.
1. Moderate Asset Allocation Prevailed
While the broad asset allocation of an average portfolio remained largely unchanged and close to the typical moderate 60/40 split, a portion of assets was reallocated from equities, cash, and commodities to fixed income. On average, equity and other mandates lost 5.3% and 1.9% over a year, respectively, benefitting fixed income funds.
This flight to safety was mostly evident in the first half of the year, as most economists still expected markets to enter a recession after a historically poor 2022. The average equity allocation fell to 50.5% from 60.4% in 2022 and bonds’ allocation reached 45%, up from 33.3% a year before. This trend reversed partially over the second half of 2023 as equities averaged 59.5% of assets as the average fixed income allocation fell to 36.1%.
Our Take
Our clients’ portfolios averaged out to a moderate asset allocation and did not change significantly year over year. But some more significant moves were observed over the course of the year. This is likely because most of the portfolios seek to provide more strategic, long-term opportunities, albeit allowing for tactical shifts. In response to warning signs of a recession flashing at the onset of 2023, investors shifted some of their assets from riskier equities into bonds. As the recessionary fears receded and a soft landing became more likely, investors turned their attention back to equity exposures.
2. Exchange Traded Funds Defended Their Top Spot
Following the same trend as the previous year, clients made their largest allocation to exchange traded funds (ETFs) in 2023. On average, ETFs comprised almost 62% of portfolios in 2022 and 63% in 2023.
When we look into the investment mandate of funds, 96% of passive exposures were implemented through ETFs. On the other hand, mutual funds were favored for active mandates, accounting for 66% of investors’ portfolios.
Additionally, investors significantly decreased holdings of common stocks, ADRs, and REITs.
Our Take
In 2023, ETFs were the predominant investment vehicle in our clients' portfolios, especially for passive investment strategies. This is likely because ETFs offer the benefits of inherent diversification, flexibility, greater transparency, and lower expense ratios. Indeed, ETFs’ median expense ratio is significantly lower than mutual funds’ (0.52% vs. 0.91%)1, making ETFs widely recognized as a primary vehicle for passive investing.
3. Actively Managed Funds on the Rise
Allocation to actively managed funds increased by 4% in 2023 compared to 2022, with active mandates now making up 43% of portfolios.
When looking into the asset class focus of active funds, 53.54% were fixed income-focused funds and 31.87% were equity-focused funds.
Within the active fixed income and equity asset class focus, investors allocated the most to intermediate core-plus bond (27.13%) and derivative income (12.33%) Morningstar Categories.
Our Take
Investors kept a balance between active and passive funds, favoring actively managed bond funds to exploit the elevated rate volatility that markets experienced last year.
Given elevated bond market volatility, high rates, and dispersed returns, it’s not surprising that active bond strategies posted their second-best performance in 10 years. In this context, managers with broader remits were able to generate out-of-benchmark alpha.
Active bond managers in the US intermediate core-plus category recorded hit rates and average alpha far above their respective 20-year averages; 68% of funds beat their benchmark with an average excess return of 0.69%.2
4. Equity Positioning Got More Defensive
Despite growing optimism, investors remained cautious and overweighted defensive stocks and underweighted cyclicals compared to their strategic benchmarks.
The average active weight of defensives increased from aggregated 1.16% in 2022 to 2.57% last year. And the overweight was visible across all defensive sectors with Consumer Staples and Health Care both turning from an underweight (-0.31% and -0.35%, respectively) to a slight overweight (0.11% and 0.14%). Most notably on the cyclicals front, underweight of Technology stocks increased to -3.3% from -1.89% on average in 2022, overweight to Real Estate decreased by 0.82%, and Financials turned from 0.17% overweight in 2022 to -0.60% underweight last year.
Equity Investors Got More Defensive
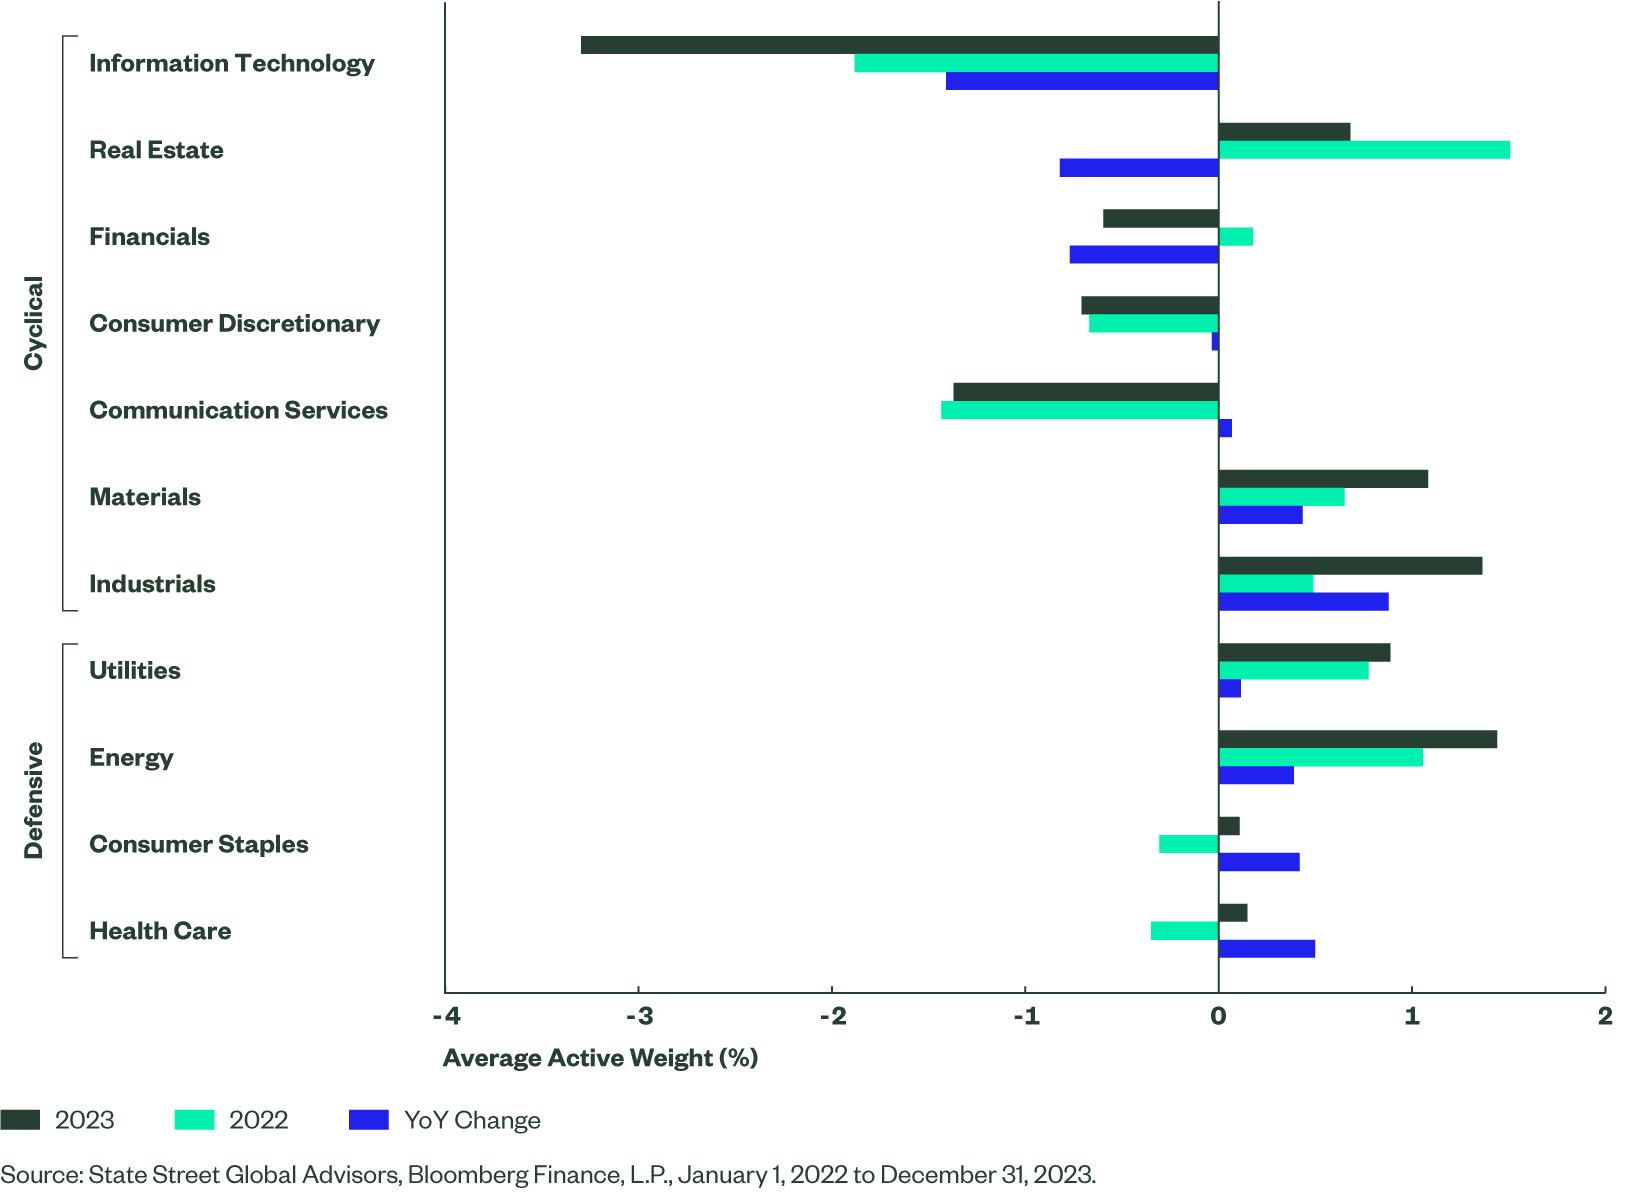
Our Take
Although the economy has exhibited surprising resilience and stock markets enjoyed a rally toward the end of last year, investors remained wary of the risks ahead and allocated tactically to capture market trends. Several US bank failures at the beginning of 2023 might have led to investors’ move out of the Financials sector, resulting in a tactical underweight. On the other hand, escalating conflict in the Middle East and potential oil supply disruptions might have turned investors’ attention toward Energy stocks. And rising geopolitical tensions that encouraged governments across the globe to increase defense spending might have boosted a demand for Industrials.
5. Investors Diversified Away from US Bonds
In fixed income, investors increased their active underweight in US bonds by 2.8% to -4.75% and their active overweight in developed market bonds by almost the same amount in 2023 compared to 2022.
In equities, portfolios were kept relatively close to their strategic benchmark.
Our Take
Core bond markets have been challenged over the past few years, evidenced by the Bloomberg US Aggregate Bond Index’s (US Agg) uneven performance and elevated levels of realized volatility in 2022 and 2023. Following the Fed’s most aggressive rate-hike campaign in four decades, investors looked at international bond exposures to diversify their fixed income sleeve. This move may have been beneficial from a total return perspective as international bonds outperformed the US Agg in 2023.3
6. Investors Moved Duration Further Out
Reversing the trend started in 2022 with the beginning of what has become the most aggressive rate-hiking campaign run by the Fed in the past 40 years, investors decreased their active weight in the ultrashort (0-1 year) portion of the bond market.
Clients still held a significant overweight in the ultrashort duration investments, but they also increased overweight/decreased underweight in all duration buckets longer than 1 year, except for the 7-10 year portion.
Our Take
As the Fed approached peak rates, investors adopted more of a total return mindset and moved further up the curve taking on some duration risk given rate cuts were expected in 2024. Following record flows into money-market mutual funds, investors are on the look out to reduce the reinvestment risk that will come with lower rates, given how sensitive ultrashort-term rates are to Fed policy rates.
7. Fewer Investors Held Gold
Despite the partial return to safety visible in our clients’ portfolios through the reallocation from equities to bonds, gold and broader commodities did not benefit from this transition. Although typically expected to perform well in periods of economic downturn, commodities were a part of only 22% of the portfolios we analyzed, down from 28% in 2022. Similarly, for physically-backed gold products, only 15.8% of analyzed portfolios held at least one gold product compared to 17.7% in the previous year.
On the other hand, those that decided to keep gold in their portfolios increased the allocation in 2023 as the average weight of gold funds in a portfolio increased from 3.3% in 2022 to 4.3% last year.
Fewer Portfolios Allocated to Gold, but the Allocations Themselves Increased
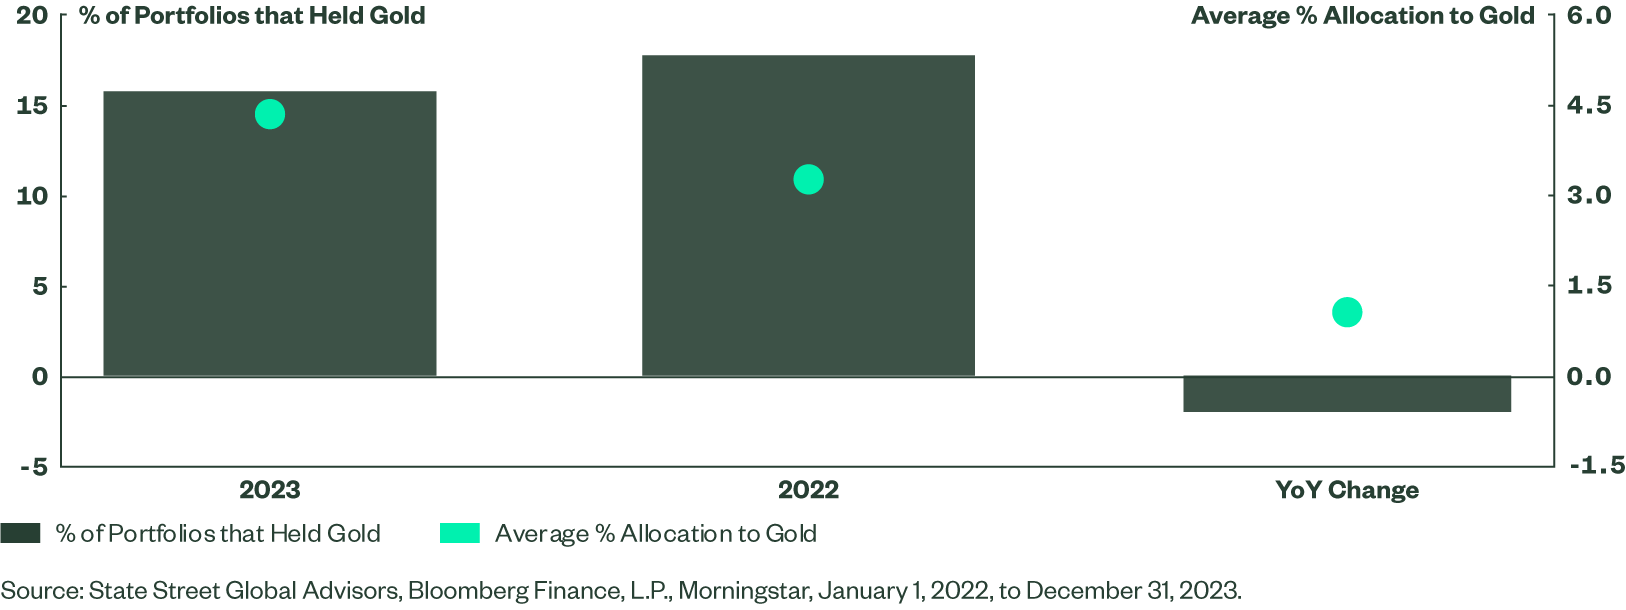
Our Take
Investors have often used gold tactically in their portfolios to help preserve wealth with a relatively liquid asset that can potentially help navigate risk during market corrections, geopolitical stress, or persistent dollar weakness. As disinflationary trends and softening economic data convinced market participants that a soft landing was in reach, investors may have looked away from precious metals. But in addition to gold’s tactical function, it can potentially play a more long-term role, providing broad benefits that can potentially support strategic investment efforts across multiple business cycles.
How to Tackle the Challenges Ahead
Two years into one of the most aggressive tightening monetary policies, market participants believe that the Fed rate-hiking spree has ended and that the rare soft landing is in reach.
In 2024, investors should not underestimate the risks of an economy that is transitioning from monetary and fiscal policy aided resilience to durable organic expansion — not to mention the potential for increased market volatility in a contentious US presidential election year. That’s where we believe portfolio analysis can help investors unveil blind spots in their portfolios.
The SPDR Americas Research Team's Portfolio Insights Analysis can help guide smart allocation decisions and reduce the risk of making unintended investments, even in a difficult market.
To learn more about Portfolio Insights Analysis, please reach out to your SPDR representative. Or visit Market Trends for our latest insights, ETF flows data, Chart Pack, and more.