New Views on US Debt, Market Concentration, and High Rates
With US debt, market concentration, and high rates continuing to make headlines and drive investor sentiment, let’s consider the impact of these mega trends through a new lens. These three charts highlight interesting angles that don’t often make the news.

Fed Policy Contributes to Surge in Debt Payments
With the Fed holding rates at 23-year highs as part of its restrictive policy stance,1 the US Treasury has had to issue more debt to fund government expenditures. The result? $34 trillion of US Treasury outstanding debt.2
Less well known is that multi-decade high rates and record Treasury issuance have pushed the total interest the US pays on its debt higher than the US national defense budget (Figure 1)!
Runaway debt certainly will come up during the US election cycle, as well as during Congress’s next debt-ceiling debate.
What’s the takeaway for investors? The higher the US’s coupon payments become, the greater barrier it presents to economic growth and stimulative government spending.
Market Concentration Is a Global Trend
A lot has been made of the record concentration by the top 10 stocks of the S&P 500 Index, where they now account for more than one-third of the index’s total market capitalization.
Yet, the current US market concentration pales in comparison to other major nations.
In fact, of the 18 nations/regions analyzed based on the total combined weight in the top 10 stocks, the US has the second-lowest concentration rate (Figure 2). Only China has lower concentration in its top 10 stocks. Some developed nations, like Spain and Switzerland have more than 75% of their market capitalization in just 10 stocks. And the average weight in the top 10 across these nations is 54%.
Figure 2: Many Countries Have Higher Top 10 Market Concentration Than the US
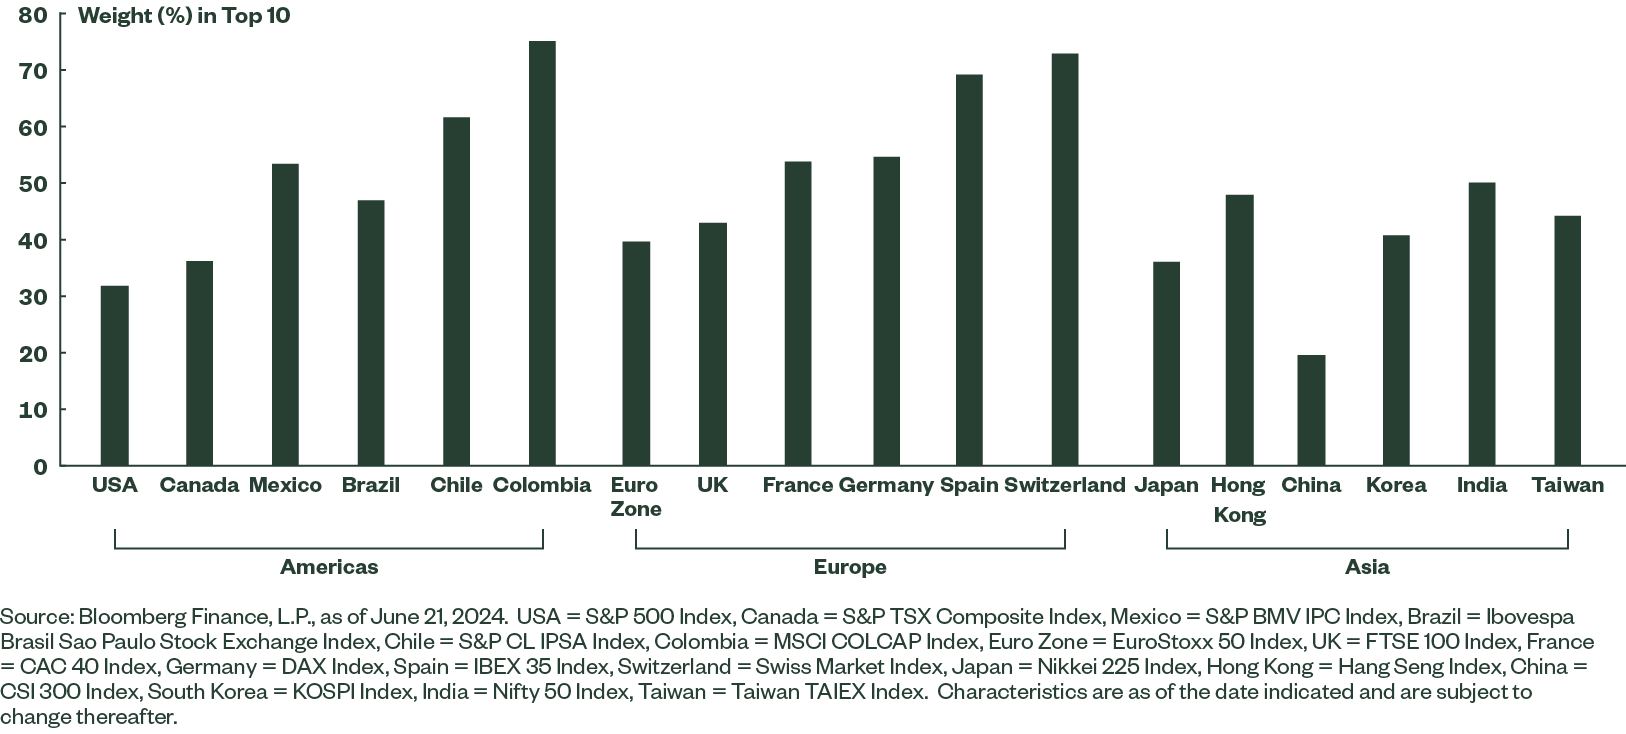
The takeaway? The next time someone says market concentration in the US is a harbinger of doom, remember this chart and the 54% top 10 average weight. And keep in mind that today’s top-heavy US market reflects the earnings power from the large mega-cap tech firms that continue to fuel the advancements in transformational technologies like Artificial Intelligence (AI).
Further, just because a market index is concentrated, doesn’t mean 1940-Act regulated investment vehicles like ETFs will have the same weight. ETFs’ diversification rules will alter the weighting scheme for those single-country ETFs, as well as other heavily concentrated exposures like sectors.
Rates Are Already Moving Lower
The Fed keeping rates restrictive supports the broad-based narrative of higher rates for longer. But that view doesn’t hold true worldwide.
Thirteen central banks have cut rates in the most recent quarter, while only two have hiked. And the increasing number of banks cutting rates over the past few quarters could be ushering in a coordinated cutting effort following the coordinated hiking that began in 2021 and accelerated in 2022. The median central bank rate across 40 of the largest central banks is now declining from its 2023 peak (Figure 3).
The takeaway? The hold that Fed policies have on market sentiment conceals the burgeoning momentum of lower rates across the globe that may help stimulate the global economy, fueling growth in overseas markets.
Look Beyond the Headlines
Market sentiment often hinges on front-page headlines, but digging into the data often reveals meaningful surprises. For more market commentary and our latest insights read our Midyear Market Outlook and bookmark our Chart Pack page.