Do Presidential Elections Influence US Equities? Using the Dow as a Performance Indicator
The resiliency of the US economy has helped spur the continued rise of US equities’ performance in the first half of 2024, but the country’s presidential election looms as a perceived key risk for volatility as we inch closer to Election Day on November 5.
While the S&P 500 Index is often used as a proxy for the performance of the US equity market overall, investors should also consider the Dow Jones Industrial Average (the Dow). The US “blue-chip” index has been a reliable indicator of the dynamic US economy since 1896, representing the profits generated from iconic products ranging from General Electric’s light bulbs to Apple’s iPhones.
Although past performance is certainly no predictor of the future, diving into the Dow’s history may help investors set expectations for a presidential election year (Figure 1). Our analysis provides some key takeaways for investors, including the potential impact of victories by either political party and why the economy’s performance typically overshadows what happens in November.
Figure 1: 100 Years of US Presidential Elections with the Dow
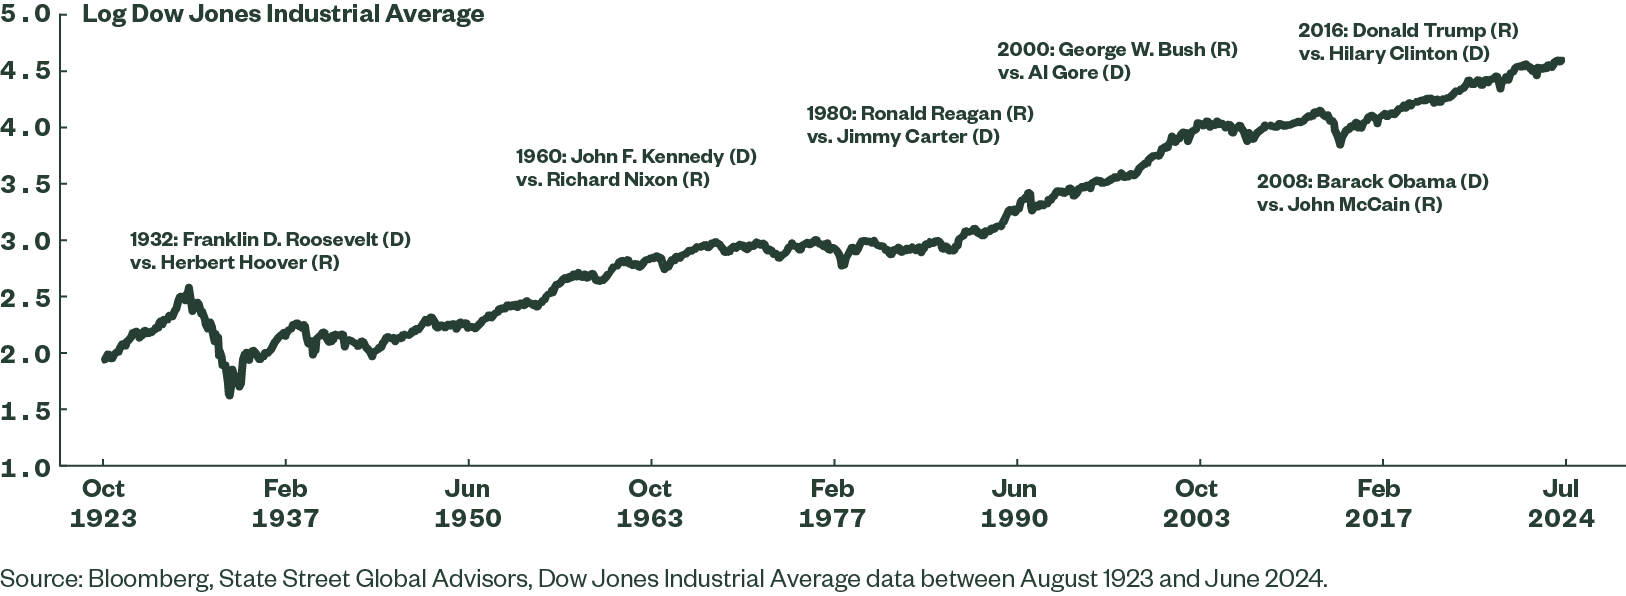
Elections Have Had a Minimal Impact on Performance
One thing that immediately stands out after analyzing nearly 130 years of the Dow’s history: there is very little difference in average performance between election and non-election years.
For the Dow, the average monthly return for election years was 0.46% versus 0.53% for non-election years.1 Election years were defined as the 12 months preceding the US presidential election.
The fact that US equity performance, as measured by the Dow, hardly deviates from the average during election years is another reminder that time in the market can be more important than timing the market. Compounding can be a powerful force when investing, but it requires discipline and patience. That said, it's easy to get caught up in the hysteria of an election year — believing that certain party affiliations more positively affect stock market performance, and that volatility always spikes in election years.
Does a Republican or Democratic Victory Affect Stock Market Performance?
The two main political parties in the US are traditionally associated with specific economic policies.
- Republicans are usually known to promote tax cuts, fiscal conservatism, and deregulation.
- Democrats, on the other hand, are often associated with increased government spending, progressive taxes, and social welfare programs.
Of course, a US president’s ability to implement policy depends greatly on how much support the president has in Congress — the US government’s legislative branch.
Nevertheless, it can be interesting to see whether there are any trends connecting the controlling party in the White House with the performance of the Dow. One way to do so is to compare the volatility of the Dow in election versus non-election years.
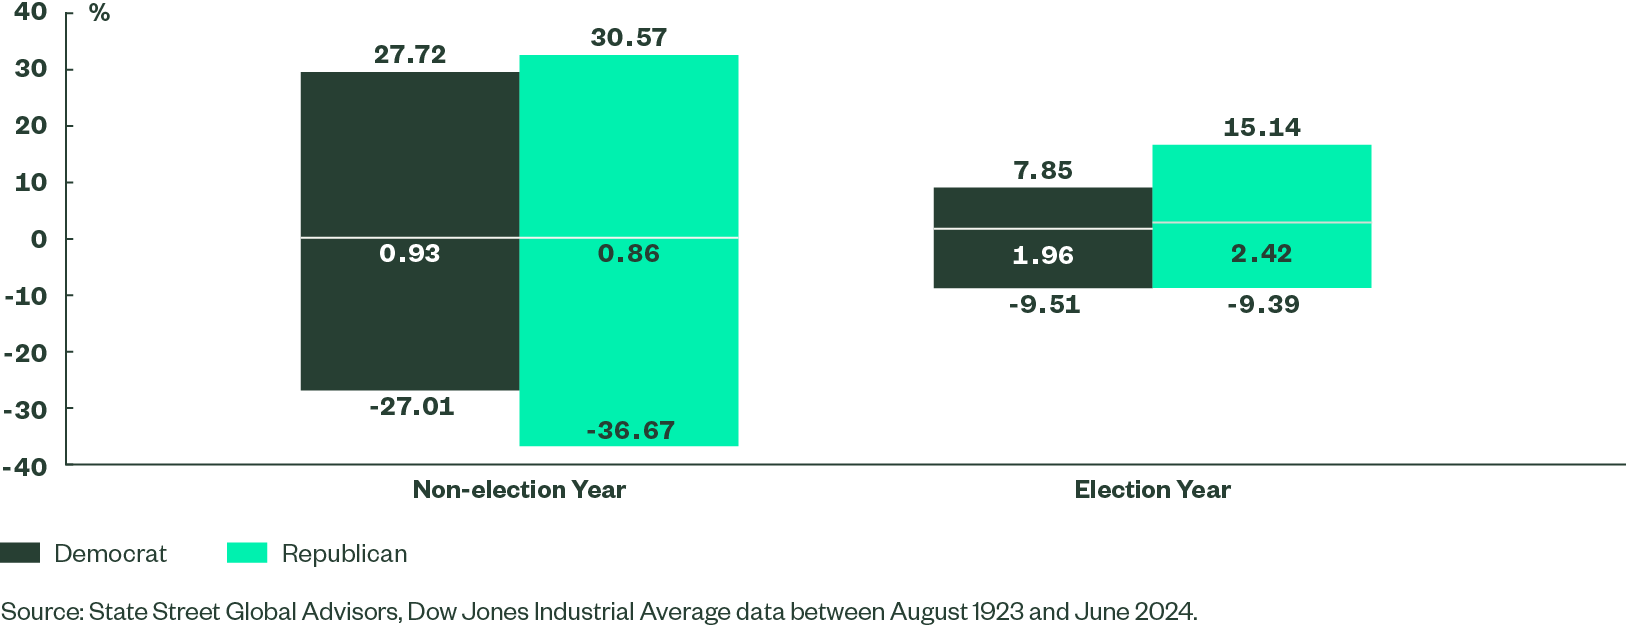
Looking at the Dow’s history, the range of return spread between election and non-election years was around 1.56% when a Republican won the presidential election, higher than the 1.03% when a Democrat won the White House (Figure 2).
Based on the perceived pro-business policies of Republicans, it is interesting that the return spread of the Dow between election and non-election years has actually been wider under Republican presidencies than under Democratic ones. In investing, sometimes analyzing the data can reveal the flaws in conventional thinking and accepted narratives.
Figure 2: Maximum, Minimum, and Median Monthly Returns During Election and Non-election Years
Based on the US President’s Party Affiliation
Does Volatility Always Spike in Election Years?
Another potential narrative that investors may believe is that US equity market volatility rises in election years. While this is true in an absolute sense, looking more closely at the data tells a nuanced story.
Although investors tend to circle upcoming elections on the calendar as potential risks, fundamental forces like the economy and corporate earnings may be the more important indicators of market volatility.
To further tease out the importance of the economy, we looked at election years and noted whether the US economy was in a recession, as defined by the National Bureau of Economic Research (NBER). Our analysis revealed that the average monthly Dow return in election years was 0.68% per month when there was no recession. When the US economy was mired in recession, however, the monthly return fell to -1.50% per month on an average basis (Figure 3).
Figure 3: Performance of the DJIA During an Election Year
NBER Based Economic Scenario During an Election Year |
Typical Monthly Returns Over an Election Year (%) |
Max (%) |
Min (%) |
Average (%) |
Elections (All Periods) |
0.84% |
30.57% |
-27.02% |
0.46% |
NBER Downturn Periods |
-1.12% |
30.57% |
-27.02% |
-1.50% |
Non-NBER Downturn Periods |
0.91% |
13.74% |
-24.46% |
0.68% |
Source: State Street Global Advisors, FRED, Robert J. Shiller, Stock Market Data Used in "Irrational Exuberance" Princeton University Press, 2000, 2005, 2015, updated, data between August 1923 and June 2024. NBER data was sourced from fred.stlouisfed.org. Inflation was defined as year on year change in CPI. Growth was defined as year on year change in US GDP.
The upshot is that the health of the economy appears to be more relevant than US presidential elections alone when it comes to US equity performance.
Gaining Exposure to Quality US Large-cap Stocks
Our research of the Dow’s rich history suggests that while election years may introduce some market volatility, long-term investors may find little reason to deviate from their investment strategies based solely on political factors.
And investors who believe the economy will avoid a recession until 2025, at least, should have even more conviction to hold US stocks in their portfolios.
To gain liquid, transparent access to US large caps that track the Dow, take a closer look at the SPDR® Dow Jones® Industrial Average ETF Trust (DIA). For over 25 years, the ETF has provided investors cost-efficient exposure to some of the leading brands and companies in the US economy.

DIA: Invest in the Bedrock of the US Economy
Discover how DIA can help you gain access to 30 blue-chip US stocks in a single trade.
The US presidential election is one of many elections around the globe this year. With campaigns now in full swing, rely on timely insights from our experts to help guide your investment decisions. Visit our 2024 Elections Insights Hub to read more.