The concentration of stocks within US large-cap equities, as represented by the S&P 500® Index, remains notably high as the top ten holdings comprise nearly 35% of the index.1 This concentration is largely driven by the exceptional performance of technology-oriented mega-cap stocks often referred to as the Magnificent 7, which includes Alphabet, Amazon, Apple, Meta, Microsoft, Nvidia, and Tesla. The increasing concentration within US large caps presents significant risk: a downturn in any of these leading stocks could result in substantial drawdowns for investors due to insufficient diversification. The continued rise of these stocks has led to premium valuations, resulting in higher investment costs.
Investors are actively seeking alternative ways to gain exposure through more affordable segments of the US market. Strategies such as blending large caps with a proportion of mid and small caps are being explored to mitigate the rising concentration within large-cap equities. Here, we’ll review the results of adding varying amounts of blended small- and mid-cap allocations into a large-cap portfolio.
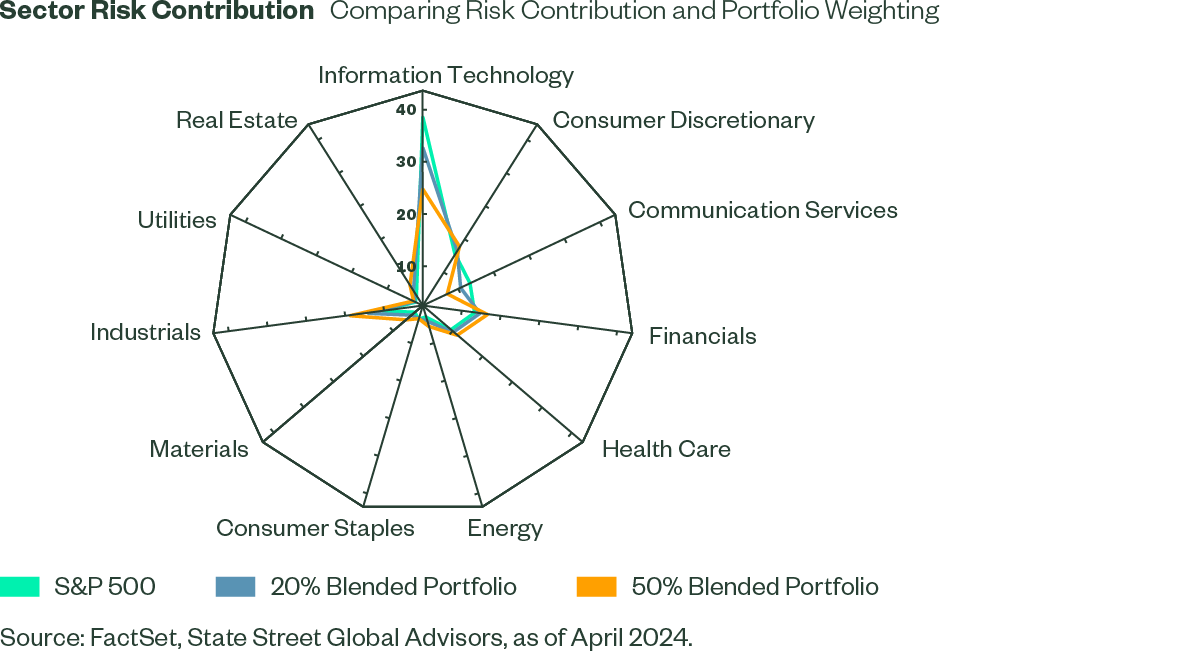
The Information Technology (IT) sector dominates the S&P 500, representing 29% of the index. This dominance also leads to an outsized risk contribution, as the sector represents 38% of the risk. Sector concentration has been increasing over time, exposing portfolios to higher sector concentration risks. Given their more balanced sector exposures, small and mid caps provide a potentially effective response for managing this risk. By blending small and mid caps, investors can achieve a more balanced sector risk contribution. For instance, a 50% blended portfolio – which involves blending 50% large cap and 50% mid and small caps - shows a more balanced sector risk map, with IT contributing 24% compared to the original 38%; Financials and Industrials can also play a significant role in helping to balance risk (see Figure 1).
Figure 1
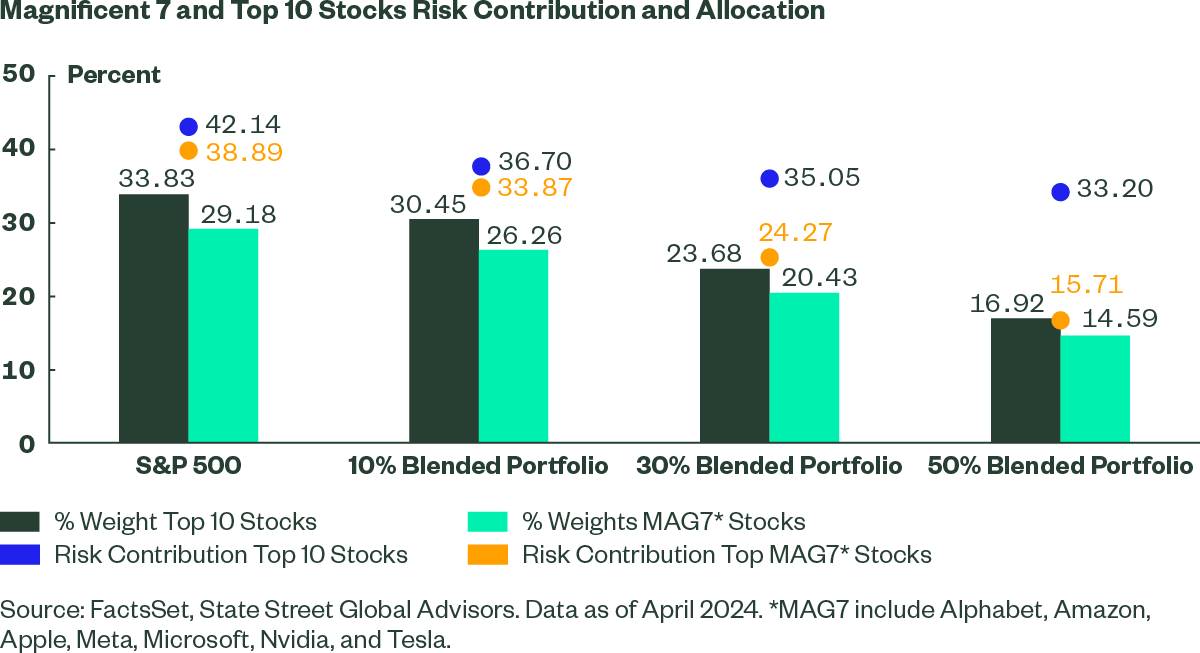
Blending small and mid caps within a US allocation also significantly reduces concentration risk from the Magnificent 7. A portfolio with 50% mid and small caps and 50% large cap exposure reduces the Magnificent 7’s risk contribution by 60%, from 38.89% to 15.71%, thus enhancing diversification within the portfolio. Our analysis indicates that even a 10% allocation to mid and small caps offers significant portfolio diversification benefits (see Figure 2).
Figure 2
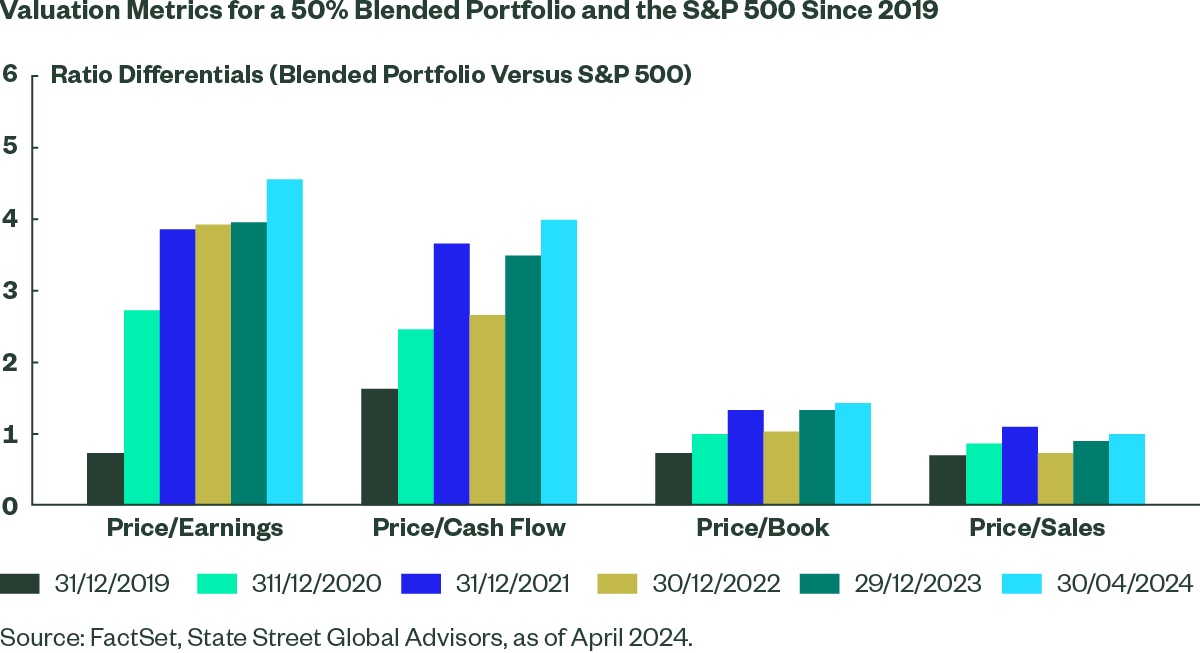
Integrating large caps with mid and small caps to gain broader US equity market exposure may reduce overall valuation. For example, a portfolio blended with 50% mid and small caps and 50% large caps exhibited a price-to-earnings (P/E) ratio of 20.5x, compared to 25x for the S&P 500, representing an improvement of approximately 20% (see Figure 3). This lower valuation for the blended portfolio extends beyond the P/E ratio to other valuation metrics, with the most significant differential observed in earnings-based measures. This disparity suggests that an earnings disappointment may lead to a more pronounced adjustment in the performance of the S&P 500 compared to the blended portfolio, given the substantial P/E differential.
Figure 3
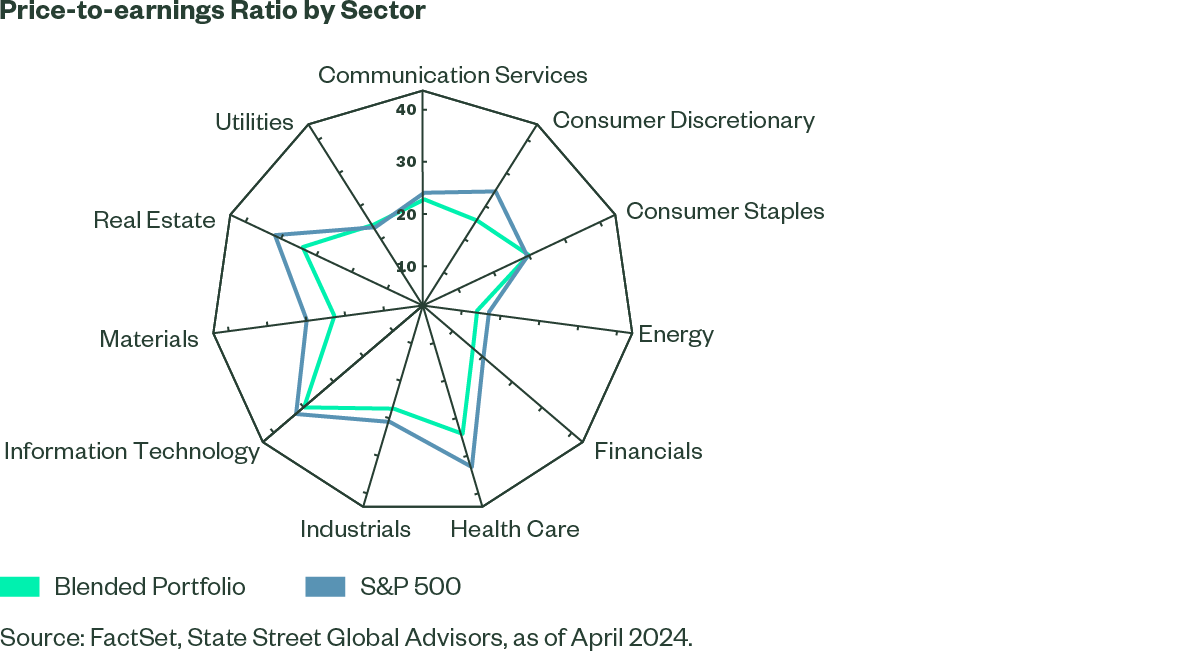
Due to the concentration of Technology companies within the S&P 500, one might attribute the high valuation differential between the blended portfolio and the S&P 500 solely to this sector. However, this is not entirely accurate. Both the Health Care and Consumer Discretionary sectors, which are among the top four sectors in the S&P 500, exhibit significantly higher valuation differentials, with ratios of 28.1x versus 35x and 20.1x versus 27.3x, respectively (see Figure 4).
Figure 4
Finally, it is important to bear in mind the widely accepted and time-tested adage is “never bet against US exceptionalism.” With interest rates peaking and the US economy primed for a soft landing, small and mid caps offer potential for higher returns. Our analysis shows that since 1995, mid and small caps have provided higher upside participation compared to the S&P 500. Historically, a portfolio with a 50% allocation to mid and small caps shows negligible deterioration in returns and a very similar risk profile. Over the past 15 years, a 50% blended portfolio exhibited a maximum drawdown of 24.83% versus 24.14% for the S&P 500.2 Investors can choose the optimal blend of mid and small caps based on their risk profiles.
IMPORTANT ACCESS DISCLOSURE
By clicking "Accept and Continue", I confirm that I have read and accept the terms and conditions of using this website (including our privacy & cookie policy) and that I am a professional investor within the meaning of the EU Directive 2004/39/EC based in Sweden. We use cookies to improve your experience on our websites. By continuing you are giving consent to cookies being used.
By accessing this section of the website, you are confirming that you are authorised to conduct investment business in Sweden, and that you are authorised under the laws of Sweden to handle material relating to investments, investment views and research that are made available only to professional investors.
Please read this page before proceeding, as it explains certain restrictions imposed by law on the distribution of this information and the countries in which the funds and advisory products and services are authorised for sale. By proceeding, you are confirming you understand that State Street Global Advisors (“SSGA”), a division of State Street Bank and Trust Company, makes no representation that the content of the website is appropriate for use in all locations, or that the transactions, securities, products, instruments or services discussed at this website are available or appropriate for sale or use in all jurisdictions or countries, or by all investors or counterparties.
This website is operated by SSGA. This section of the website is only directed at Swedish financial advisors that qualify as, or are otherwise acting on behalf of, professional investors (within the meaning of Article 4, Section 1(ag) of Directive 2011/61/EU of the European Parliament and of the Council of 8 June 2011) and is not suitable for individual investors, as this section of the website contains information on alternative investment funds (AIFs) and certain advisory products and services. If you are an individual investor, please leave this section of the website immediately.
It is your responsibility to be aware of and to observe all applicable laws and regulations of any relevant jurisdiction. Certain of the funds and advisory products and services referenced on this website may be managed or offered/provided by affiliates of SSGA, certain of which may be registered or otherwise licensed to conduct business in Sweden. Additionally, certain of the funds described in the following pages may be marketed in certain jurisdictions only.
By accessing this website, you are confirming that you agree to the Terms and Conditions of this website and that you are based in Sweden and are (or are acting on behalf of) a professional investor.
The contents of this website have been prepared for informational purposes only without regard to the investment objectives, financial situation, or means of any particular person or entity, and SSGA is not soliciting any action based upon them. No information included on this website is to be construed as investment advice or as a recommendation or a representation about the suitability or appropriateness of any fund or advisory product or service; or an offer to buy or sell, or the solicitation of an offer to buy or sell, any security, financial product, or instrument; or to participate in any particular trading strategy. SSGA recommends that you seek independent financial advice before making any investment decisions. Investment in any of the funds described in this website should only be made on the basis of the terms and conditions of the most recent applicable offering documents (including any relevant supplements). Investment in any of the advisory products or services described in this website should only be made on the basis of the terms and conditions of the related investment management agreement.
All material has been obtained from sources believed to be reliable, but its accuracy is not guaranteed. Some of the content on this website may contain certain statements that may be deemed forward-looking statements. Please note that any such statements are not guarantees of any future performance and actual results or developments may differ materially from those projected. From time to time, SSGA may also make additional features available to users on this website on such terms and conditions as may be set forth in a modification to this Agreement or otherwise on the SSGA website.
GENERAL RISK FACTORS
You should be aware that past performance is not a reliable indicator of future performance. Please note that the price of investments and the income from them can fall as well as rise and you may not get back the amount originally invested. Income receivable may vary from the amount of income projected at the time of making the investment.
Exchange rate fluctuations may affect the value of an investment and any income derived from it.
Fund investors exercising any right to redeem units/shares of any fund may not get back the amount initially invested if the unit or share price has fallen since the initial investment. Deductions for charges and expenses, particularly the initial charge (if any), are not made uniformly throughout the life of the investment, so fund investors redeeming out of the fund during the early years may not get back the amount invested.
There can be no guarantee that the tax position or proposed tax position prevailing at the time of an investment will not change. Dividends and capital gains on securities may be subject to withholding taxes imposed by the countries in which the investments are held.
Fund investors must read the most recent applicable offering documents (including any relevant supplements) for a summary of the risk factors pertaining to the investment. Please note, however, that no summary of risk factors is exhaustive, and there may be other risks that could affect your investment.
The information provided on this website is not intended for distribution to, or use by, any person or entity in the United States, or in any jurisdiction or country where such distribution or use would be contrary to law or regulation, or which would subject any of the funds described herein, SSGA (including its affiliates) or any of their products or services to any registration, licensing or other authorisation requirement within such jurisdiction or country. Nothing on this website shall be considered a solicitation to buy or sell a security, product or service (including advisory service) to any person.
HYPERLINKS
SSGA does not recommend or endorse and accepts no responsibility for the content of any website not operated by SSGA which you may visit by following a link from this website. You acknowledge and agree that neither SSGA nor any of its affiliates is responsible for the availability of such third-party websites or resources, does not endorse, approve, investigate or verify, and is not responsible or liable for any content, advertising, products, or other materials on or available from such websites or resources. You further agree that neither SSGA nor any of its affiliates shall not be responsible or liable, directly or indirectly, for any damage or loss caused or alleged to be caused by or in connection with use of or reliance on any such content, products or services available on such external websites or resources. These links are provided as a convenience and solely for informational purposes. SSGA is not making any recommendation to invest in, purchase, or sell any securities or other products or services offered on the linked websites, nor has SSGA sought to verify or confirm the information contained in the linked websites. Accordingly, SSGA disclaims any responsibility for the linked websites.
No other website, without the prior written permission of SSGA, is authorized to link to any part of this website.
COOKIES
SSGA uses cookies for collecting user information from certain pages of this website. A cookie is a file that is stored on the hard disk of a computer by the web browser on a computer. It contains information sent by the website that a user has visited. A cookie identifies users and can store information about them and their use of a website. SSGA uses cookies to keep track of user activity, which allows SSGA to identify which areas of the website are more interesting to the users so that improvements can be made to this website.
SSGA expressly reserves the right to monitor any use of this website.
I confirm that I have read and accept the Terms and Conditions of using this website and that I am based in Sweden and am (or am acting on behalf of) a professional investor.