Insights

EU Climate Benchmarks: Index Construction Matters

In this paper, we assess standard ‘off-the-shelf’ index offerings from S&P, MSCI, FTSE and Solactive, those most readily accessible to investors. Of course, there are other indices in the market and many providers are open to customised index solutions.

Portfolio Strategist, Systematic Equity Beta

In our recent papers, we discussed the standards and implications of Climate Transition Benchmarks (CTB) and Paris-Aligned Benchmarks (PAB), and what to consider when choosing between them ('EU Climate Benchmarks: Standards and Implications' and 'EU Climate Benchmarks: Paris Aligned or ClimateTransition?'). The EU defined these climate benchmarks to establish minimum standards for indices to align with IPCC’s 1.5°C trajectory and net zero in 2050.

Current index offerings can be best understood collectively as climate strategies that comply with PAB or CTB minimum standards, rather than all PABs being the same, and all CTBs being alike: they vary by index design, active exposures and return profile (see Appendix 1 for details). In this paper, we assess standard ‘off-the-shelf’ index offerings from S&P, MSCI, FTSE and Solactive, those most readily accessible to investors. Of course, there are other indices in the market and many providers are open to customised index solutions.

Index Design Inputs: EU Climate Benchmarks Are Built Differently

There are many ways in which climate indices can be built, including the input data (how companies are assessed from a climate perspective) and index construction (how the data is practically utilised to yield an index). These differences are for good reason: investors have different rationale and motivation for implementing sustainable investments (see Figure 1) and therefore different portfolio objectives. Differences in index design often aim to meet different portfolio objectives, or combinations of these. Arguably, this is a benefit of the regulation, which sets standards while allowing room for innovation and meeting a variety of goals.

Figure 1: Differing Rationale for Implementing Sustainable Investment

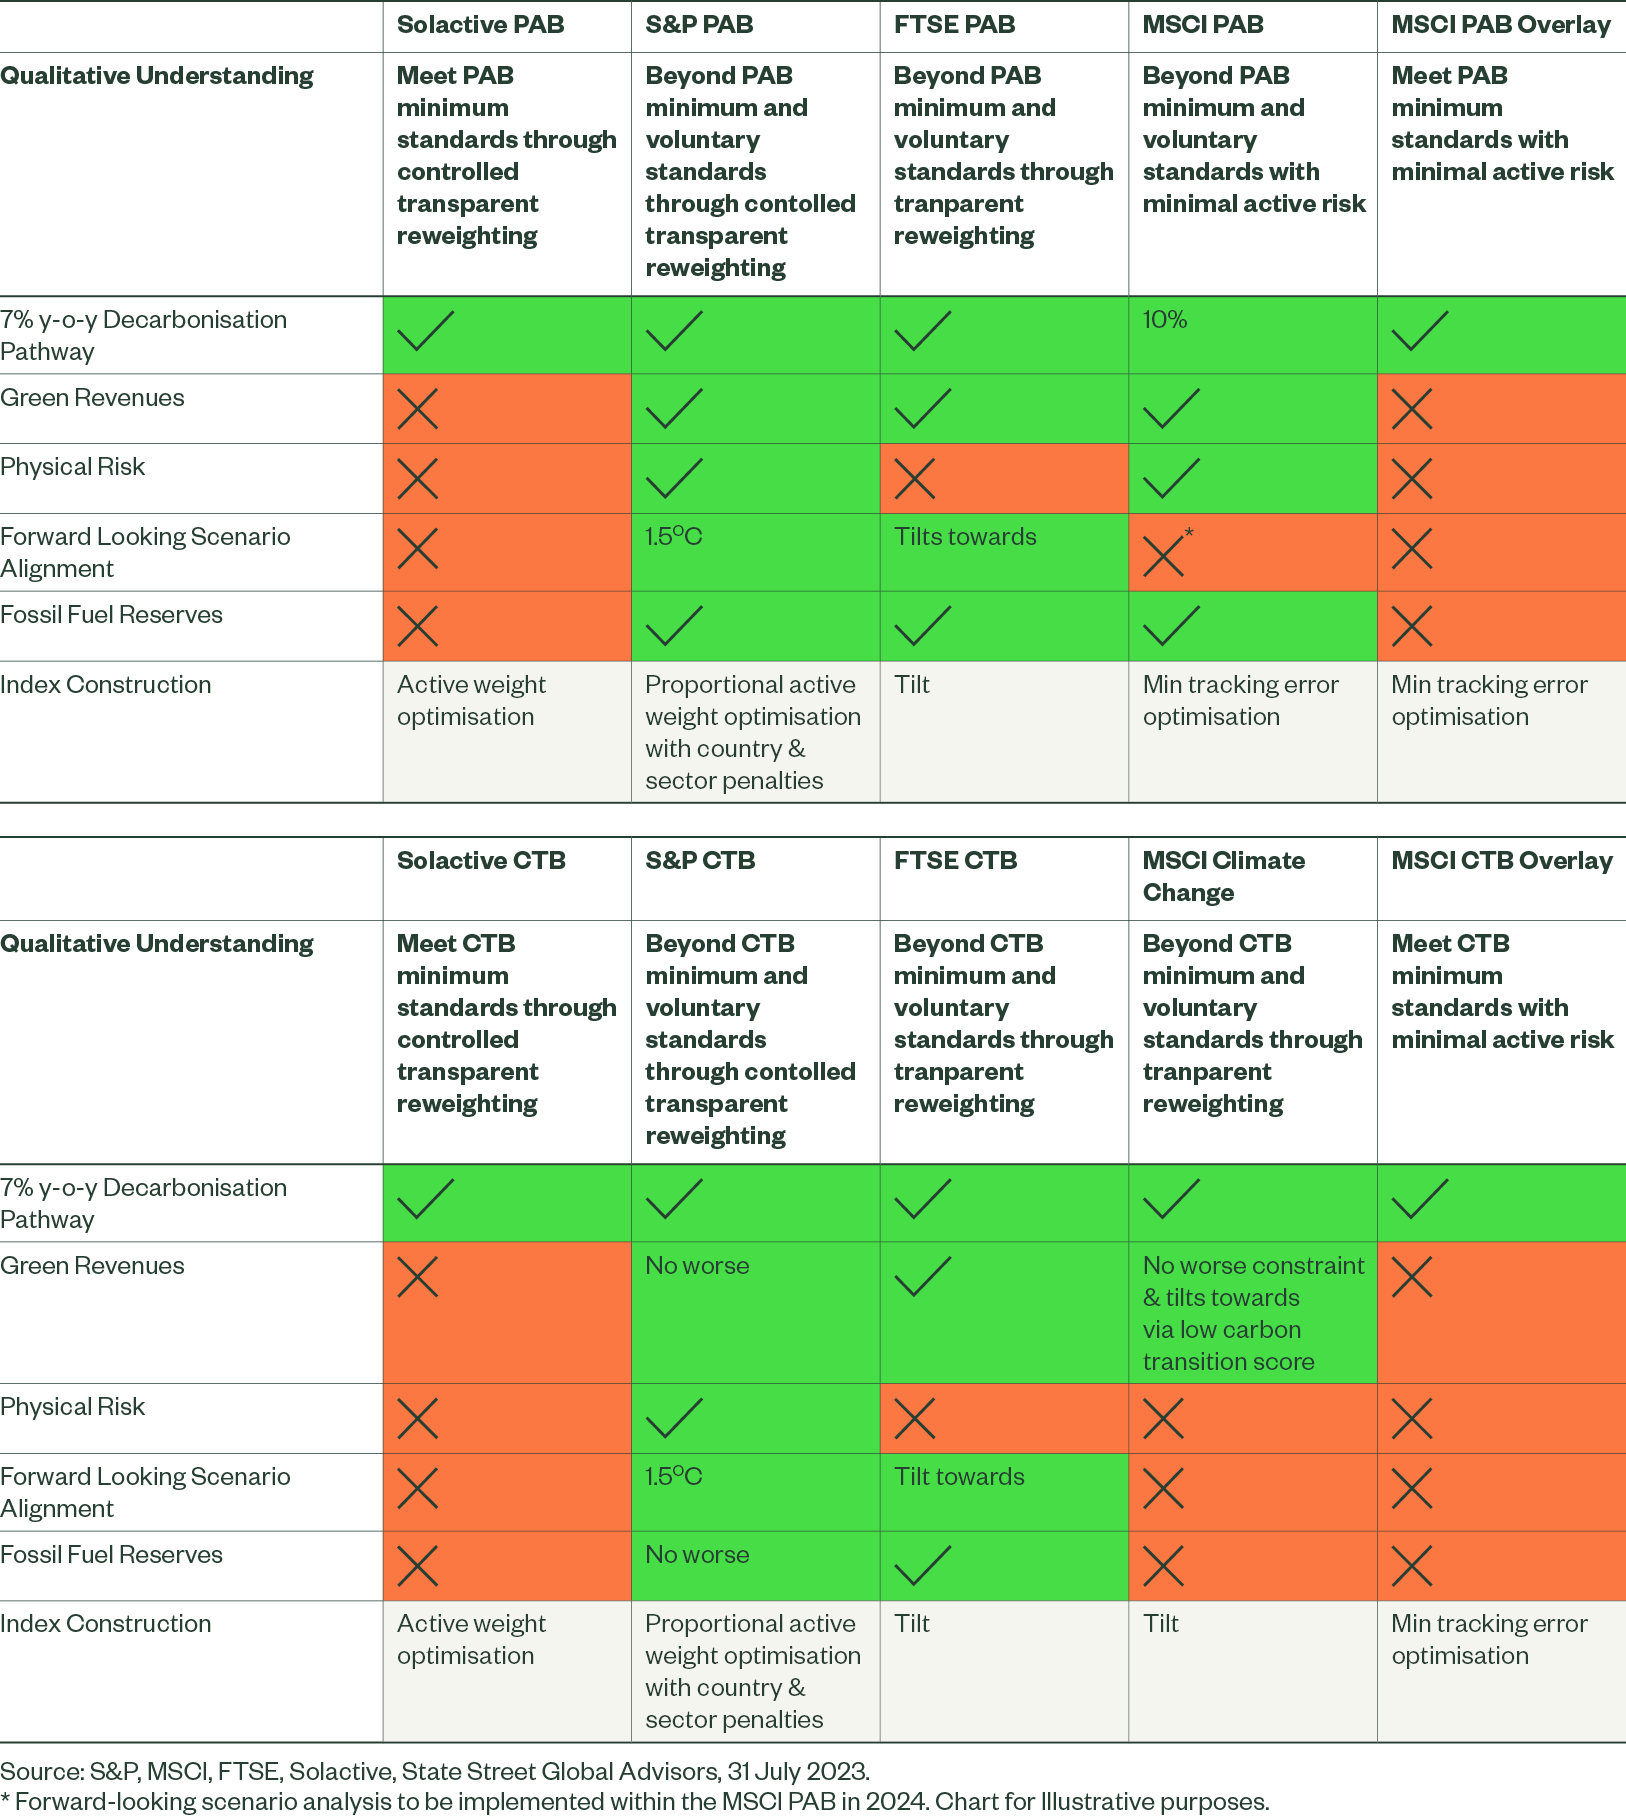
From an input standpoint (see Figure 2 for summary and Appendices 4 & 5 for further details), the Solactive and MSCI overlay indices largely aim to meet the minimum requirements laid out by the EU (see Appendix 2).1 This is a different approach from the S&P and FTSE indices, alongside the MSCI PAB and MSCI Climate Change indices, each of which measures companies with metrics that go beyond the minimum regulatory standards. These include green revenues, which the regulation deems ‘voluntary’, measures assessing the forward-looking climate pathways (as recommended by many investor bodies and others),2 and the physical risks companies may face from climate change. Additional metrics can yield a more nuanced view of companies’ climate risks, impacts and opportunities, similar to how fundamental analysts may look at a scorecard or range of metrics in assessing companies,3 rather than purely relying on carbon intensity.

A major difference between providers, and even within a provider’s own offerings, is the index construction method used. Some use more transparent tilted methods, such as the FTSE indices and the MSCI Climate Change Index series, while the MSCI PAB and overlay index series minimise tracking error through an optimisation process. Tracking error measures the difference in return between a strategy and its benchmark or parent index, measuring the volatility of excess return.4 The S&P and Solactive indices strike a middle ground and utilise the power of optimisation, albeit in different ways that do not use a risk model to estimate tracking error. More transparent weight allocations can help users better understand why companies receive the weight they do, potentially benefiting understanding of the indices. Transparent allocations would often receive a higher correlation between the active weights companies receive and the input data, which may be more suitable if the goal is to create real-world impact through capital allocation mechanisms. However, the lower tracking error generally observed from tracking error minimisation can often supersede the need for increased transparency.

Figure 2: EU Climate Benchmarks Are Not Built Equally

EU Climate Benchmarks Are Not Built Equally

Active Exposures: Index Design Differences Drive Divergent End Results

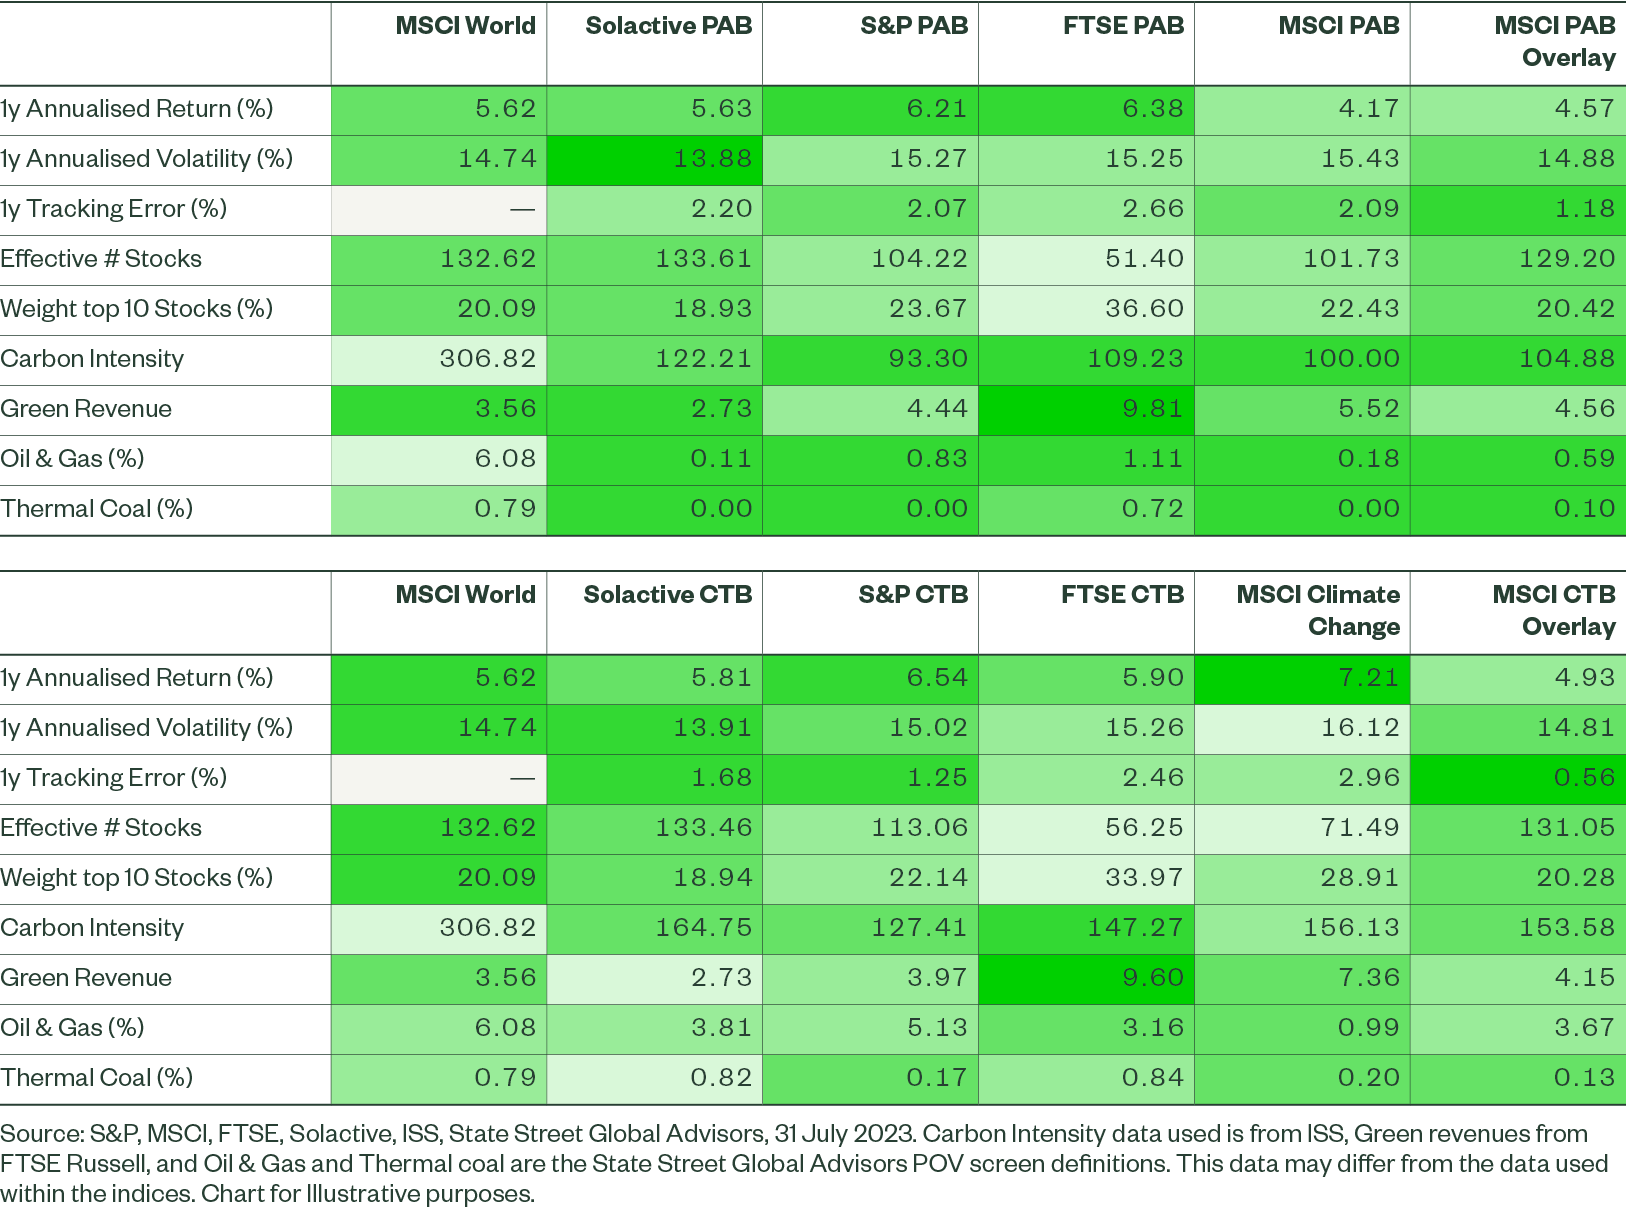
When indices share the same minimum regulatory standards, even if they’re built differently, how much can they really differ? The answer: quite a lot.5 We see this in multiple areas related to climate and other considerations within portfolios, such as active risk and concentration (see Exhibit 3).

For example, the FTSE indices tend to overweight companies with green revenues to a large extent, gaining close to three times the exposure, while the Solactive indices do not explicitly incorporate green revenues and actually see a tilt away from them. In contrast, the MSCI overlay indices do not control for green revenues but still show an improvement nonetheless.

Figure 3: EU Climate Benchmarks Outcomes Are Not Equal

Above: Paris-Aligned Benchmark; Below: Climate Transition Benchmark

EU Climate Benchmarks Outcomes Are Not Equal5

Beyond the climate characteristics, we purposely focus more on active exposures rather than performance, given there is no obvious significant alpha6 since launch (see Appendix 77). To illustrate the impact index design can have on tracking error, we can compare the MSCI CTB Overlay and the MSCI Climate Change indices. Both comply with the CTB label and use the same data sources, but differences in the index construction method and the incorporation of other objectives beyond the CTB standards leads to strikingly different results. The MSCI CTB Overlay index can be interpreted as an approximation of the lowest tracking error possible while meeting the CTB label.8 Alternatively, the MSCI Climate Change uses a tilted methodology and has objectives beyond the regulatory minimum standards.

The MSCI Climate Change index had over five times the tracking error9 of the MSCI CTB Overlay index, resulting in a very different active return potential. Historically, the MSCI Climate Change Index had a maximum active return over a six-month period of 710 basis points (bps), eight times that of the MSCI CTB Overlay, with a maximum active return of 88 bps over any six-month period since the end of 2016 (see Appendix 9 for visualisation). The role of the index construction is also evident when comparing the S&P CTB which has even more ambitious climate objectives than the MSCI Climate Change index. Despite this, the S&P CTB has a significantly lower tracking error (less than half) than the MSCI Index. This shows how decisions related to index construction and the inclusion of insights beyond the minimum standards can cause meaningfully different exposures and performance outcomes.

With respect to index construction, we understand generally that tracking error minimisation helps to control active risk (as used within the MSCI CTB Overlay indices) efficiently per unit of active exposure. This is challenging to manage to the same extent with a simpler tilted framework, as shown by State Street Global Advisors research.10

Generally speaking, the indices active sector and factor allocations are directionally similar. Across all indices, both PAB and CTB, they are underweight the energy sector and overweight tech, with a growth (negative value) tilt (see Exhibit 4). However, the magnitudes of these active positions are very different. S&P Indices tend to take the lowest active sector positions, with an average active sector weight of less than 30 bps for their CTB and around 1% for the PAB, while the FTSE indices take a 3% and 3.6% average absolute sector weights for their respective EU Climate Benchmark classes. Again, the portfolio construction likely plays a significant role here, where S&P minimise active sector weights directly, while the tilted methodology employed by FTSE and the MSCI Climate Change index don’t have these features.

Two areas where indices also diverge noticeably are in their consumer discretionary sector and size exposures. For example, the FTSE indices show a large overweight in the consumer discretionary sector, while most others show neutral to underweight positions. This is primarily caused by very large active positions in a couple of large names, rather than the average company being overweighted. Differences in size exposure are likely driven by the portfolio construction method. Tilted indices tend to a large size bias, whereas indices utilising active share from Solactive tilt towards smaller-cap stocks. These takeaways are consistent and as one may expect, but illustrate the importance of index construction. Not all PABs are the same, nor are all CTBs.

Two areas where indices also diverge noticeably are in their consumer discretionary sector and size exposures. For example, the FTSE indices show a large overweight in the consumer discretionary sector, while most others show neutral to underweight positions. This is primarily caused by very large active positions in a couple of large names, rather than the average company being overweighted. Differences in size exposure are likely driven by the portfolio construction method. Tilted indices tend to a large size bias, whereas indices utilising active share from Solactive tilt towards smaller-cap stocks. These takeaways are consistent and as one may expect, but illustrate the importance of index construction. Not all PABs are the same, nor are all CTBs.

Figure 4: Active Allocations Are Directionally Similar, But Varied

Paris-Aligned Benchmark

Active Allocations Are Directionally Similar, But Varied

Climate Transition Benchmark

Active Allocations Are Directionally Similar, But Varied

Index Return Profile: Maybe Not As We Would Expect

While we see that active sector and factor exposures tend to be directionally similar across EU Climate Benchmark aligned indices, with varying levels of active risk, what is the difference in the indices’ return profile? Specifically, we consider whether EU Climate Benchmark aligned indices have similar return characteristics to each other; whether PABs across providers show returns that are distinct from CTBs; if index construction methods yield characteristics specific to that method; and whether the index provider (including the data they use) affect the pattern of return.

To answer these questions, we assess the correlations of excess returns.11 In the graphic below we ‘cluster’12 the correlations — a process that helps to break down the indices into smaller groups that have similarities in their return profile. On the left-hand side of Figure 5, we can see a graphic that displays these clusters as a hierarchy or a tree-like structure. Where the vertical line is further to the right, it represents two indices (such as the two FTSE indices at the bottom) that have a more similar return profile. The inverse is also true.

Figure 5: Index Construction May Better Explain Return Profile Than PAB or CTB Alignment

Index Construction May Better Explain Return Profile Than PAB or CTB Alignment

We see that EU Climate Benchmarks, with the exception of the Solactive CTB and MSCI Climate Change indices, are directionally similar showing a positively correlated excess return. Within this universe, the Solactive indices appear to differ the most from other indices, possibly due to their index construction method and factor exposures that diverge from other providers.

Interestingly, among the indices analysed, the index construction method (i.e. optimisation or tilting) had more similarities versus the PAB or CTB classification ‘label.’ Clustering indices in this way suggests that two indices with the same portfolio construction method may be most similar, which cannot be said for PABs or CTBs.

Unfortunately, it is not easy to separate what is specific to an index provider and portfolio construction method, given that S&P and Solactive use methods that are unique to them. However, MSCI use both tilting and tracking error minimisation, with their tilted methodology (MSCI Climate Change) appearing more similar to the FTSE tilt than to their other indices that minimise tracking error. This further highlights the importance of an index construction technique when assessing the return outcome of EU Climate Benchmarks.

The Bottom Line

Investors have an abundance of choice when it comes to selecting EU Climate Benchmark aligned indices. Given the differences noted, indices should be thought of as climate strategies adhering to PAB or CTB minimum standards, rather than being looked at uniformly as a PAB or a CTB. This is evidenced in the index design inputs, such as index construction method and data leveraged, as well as in the active exposures (i.e. sector and factor allocations), and the pattern of returns over time. This in turn means selecting the ‘right’ index to meet specified goals is important.

In our next paper in this series we examine some of the key considerations around differences in index design inputs and portfolio construction methods that investors can apply when selecting the right index to meet their climate goals and objectives.

Appendix 1: Indices Assessed

Abbreviated Index Name

Official Index Name

Index Provider

EU Benchmark

Solactive PAB

Solactive ISS ESG Developed Markets Paris-Aligned Benchmark Index

Solactive

PAB

Solactive CTB

Solactive ISS ESG Developed Markets Climate Transition Benchmark Index

Solactive

CTB

S&P PAB

S&P Developed Ex-Korea LargeMidCap Net Zero 2050 Paris-Aligned ESG Index

S&P Dow Jones Indices

PAB

S&P CTB

S&P Developed Ex-Korea LargeMidCap Net Zero 2050 Climate Transition ESG Index

S&P Dow Jones Indices

CTB

MSCI PAB

MSCI World Climate Paris Aligned Index

MSCI

PAB

MSCI PAB Overlay

MSCI World EU PAB Overlay Index

MSCI

PAB

MSCI Climate Change

MSCI World Climate Change Index

MSCI

CTB

MSCI CTB Overlay

MSCI World EU CTB Overlay Index

MSCI

CTB

FTSE PAB

FTSE Developed ex Korea ex Poland Paris-aligned (PAB) Index

FTSE Russell

PAB

FTSE CTB

FTSE Developed ex Korea ex Poland Climate Transition (CTB) Index

FTSE Russell

CTB

Source: S&P, MSCI, FTSE, Solactive, State Street Global Advisors, 30 June 2023.

Appendix 2: EU Climate Benchmark Minimum Standards

Minimum Standards

EU Climate Transition Benchmark (CTB)

EU Paris Aligned Benchmark (PAB)

Risk oriented minimum standards:

Minimum Scope 1+2(+3)[1] carbon intensity reduction compared to investable universe

30%

50%

Scope 3 phase-in

Up to 4 years from 23rd December 2020

Baseline Exclusions

Controversial Weapons

Societal norms violators[2]

Tobacco

Activity Exclusions

No

Coal (1%+ revenues)

Oil (10%+ revenues)

Natural Gas (50%+ revenues)

Electricity producers with carbon intensity of lifecycle GHG emissions higher than 100gCO2e/kWh (50%+ revenues)

Opportunity oriented minimum standards:

Year-on-year self-decarbonisation of the benchmark

At least 7% on average per annum: in line with or beyond the decarbonisation trajectory from the IPCC’s 1.5°C scenario (with no or limited overshoot)

Minimum green share / brown share ratio compared to investable universe (voluntary)

At least equivalent

Significantly larger (factor 4)

Exposure constraints

Minimum exposure to sectors highly exposed to climate change issues is at least equal to equity market benchmark value

Corporate Target Setting (voluntary)

Weight increase shall be considered for companies which set evidence-based targets under strict conditions to avoid greenwashing (see Article 9 in section 5.12 re conditions)

Disqualification from label if 2 consecutive years of misalignments with trajectory

Immediate

Relevance oriented minimum standards:

Review Frequency:

Minimum requirements shall be reviewed every three years to recognise market development as well as technological and methodological progress.

Source: Official Journal of the European Union & EU TEG Final Report.

Appendix 3: Indices Assessed

Criteria

PAB Requirement

Solactive PAB

S&P PAB

FTSE PAB

MSCI PAB

MSCI PAB Overlay

Carbon intensity reduction

50%

50%

50% + 5% Buffer

50% + 0.5% Buffer

50%

50%

Decarbonisation

7% y-o-y (inflation adjusted)

7%

7%

7%

10%

7%

Carbon measure

Scope 1+2(+3)/EVIC (scope 3 phased in over time)

Scope 1+2+3/EVIC

Scope 1+2+3/EVIC

Scope 1+2(+3 phased in)/EVIC

Scope 1+2+3/EVIC

Scope 1+2+3/EVIC

Baseline exclusions

Controversial Weapons
Societal norms violations
Tobacco

Controversial Weapons
Societal norms violations
Tobacco

Controversial Weapons
Societal norms violations (UNGC & ESG Controversies)
Tobacco

Controversial Weapons
Tobacco

Controversial Weapons
Societal norms violations (ESG & Environmental Controversies)
Tobacco

Controversial Weapons
Societal norms violations (ESG & Environmental Controversies)
Tobacco

Activity exclusions

1% Coal
10% Oil
50% Natural Gas
50% Highly Intensive Electricity Production

1% Coal
10% Coal, Oil & Gas
50% Highly Intensive Electricity Production

1% Coal
10% Oil
50% Natural Gas
50% Highly Intensive Electricity Production

1% Coal
10% Oil
50% Natural Gas
50% Highly Intensive Electricity Production

1% Coal
10% Oil & Natural Gas
50% Highly Intensive Electricity Production

1% Coal
10% Oil & Natural Gas
50% Highly Intensive Electricity Production

Further exclusions


SDGs 12, 13, 14, 15: Significant negative impact

Small arms
Military contracting
Thermal coal power generation
Oil sands
Shale energy
Gambling
Alcohol

Oil sands


Exposure to High Climate Impact NACE Sectors

No Lower than parent

No Lower than parent

No Lower than parent

No Lower than parent

No Lower than parent

No Lower than parent

Green/Brown (voluntary)

4x


4x


4x


Green revenue


100% increase

100% Increase


Corporate target setting (voluntary)

Weight increase for companies with Science Based Targets

Increase

20% increase


20% increase


Fossil fuel reserves


80% decrease

50% decrease

50% decrease


Carbon Transition Score


Reduction in low carbon transition score by 10%


Carbon Governance Score


TPI MQ 0.2 std increase


Climate VaR


Max(0, Aggregate Climate VaR of Parent Index)


Physical risk


Score based: 10% decrease & max stock weight capping curve


VaR based: 50% reduction


Forward looking scenario alignment


1.5ºC

TPI carbon performance tilt towards best and away from worst (tilt factor 1).  Exclude companies with not aligned emissions reductions.

Implied Temperature Rise to be implemented in 2024.


ESG score improvement


Underlying index waESG after 20% of the lowest ESG scoring stocks by count are removed and their weight redistributed


ESG/Climate data quality cap


weight of non-disclosing carbon companies 1.1x parent weight cap

ICB bank sub-sector companies capped at parent weight


Data providers


ISS

S&P Global ESG, S&P Global Trucost, Sustainalytics

FTSE, TPI, Sustainalytics

MSCI

MSCI

Portfolio construction


Minimise active weights

Minimise proportional active weight optimisation with country & sector penalties

Tilted

Minimise ex-ante tracking error

Minimise ex-ante tracking error

Rebalance frequency


Quarterly

Annual

Semi-Annual

Semi-Annual

Sector constraint


Min(5% and half of the weight of the sector)+-
if cannot be met, constrain minimum sector weight as sum of eligible weight within the sector


5%+-

5%+- (except Energy)

5%+- (except Energy)

Country constraint


5%+-

5%+-

5%+-

Company/constituent level constraint


0.5%+- (constituent level)

2%+- (Company level)


2%+- (constituent level)

2%+- (constituent level)

Company minimum weight


0.01% (included rather than removed)

Existing constituents: ≥ 0.01%
New constituents: ≥ max(0.01%, min(0.05,0.5 × underlying stock weight))

0.05%

0.01%


Company max weight


5%

max(5%, underlying company weight)

5%


Max weight multiple


20x

20x

20x

Effective n


25% parent


Liquidity cap


Capped at the company level based on 5 hypothetical days to sell, with 10% participation using 3-month MDVT for a 1bn USD notional


Beta constraint


0.7-1.3


Turnover constraint


5% one-way

5% one-way

Common factor risk aversion


0.0075

0.0075

Specific risk aversion


0.075

0.075

Source: S&P, MSCI, FTSE, Solactive, State Street Global Advisors, 30 June 2023.

Appendix 4: CTB Aligned Indices Further Details

Criteria

CTB Requirement

Solactive CTB

S&P CTB

FTSE CTB

MSCI Climate Change

MSCI CTB Overlay

Carbon intensity reduction

30%

30%

30% + 5% Buffer

30% + 0.5% Buffer

30%

30%

Decarbonisation

7% y-o-y (inflation adjusted)

7%

7%

7%

7%

7%

Carbon measure

Scope 1+2(+3)/EVIC (scope 3 phased in over time)

Scope 1+2+3/EVIC

Scope 1+2+3/EVIC

Scope 1+2(+3 phased in)/EVIC

Scope 1+2+3/EVIC

Scope 1+2+3/EVIC

Baseline exclusions

Controversial Weapons
Societal norms violations
Tobacco

Controversial Weapons
Societal norms violations
Tobacco

Controversial Weapons
Societal norms violations (UNGC & ESG Controversies)
Tobacco

Controversial Weapons
Tobacco

Controversial Weapons
Societal norms violations (ESG & Environmental Controversies)
Tobacco

Controversial Weapons
Societal norms violations (ESG & Environmental Controversies)
Tobacco

Further exclusions


SDGs 12, 13, 14, 15: Significant negative impact


Thermal coal
Oil sands

Thermal coal mining


Exposure to High Climate Impact NACE Sectors

No Lower than parent

No Lower than parent

No Lower than parent

No Lower than parent

No Lower than parent

No Lower than parent

Green/Brown

No Lower than parent


No Lower than parent


No Lower than parent


Green revenue


100% increase

100% Increase


Corporate target setting

Weight increase for companies with Science Based Targets

No Lower than parent

No Lower than parent


No Lower than parent


Fossil fuel reserves


No Lower than parent

30% decrease

50% decrease


Carbon Transition Score


Tilts towards


Carbon Governance Score


TPI MQ 0.2 std increase


Physical risk


Score based: no lower than parent & max stock weight capping curve


Forward looking scenario alignment


1.5ºC

TPI carbon performance tilt towards best and away from worst (tilt factor 1).  60% emissions reductions of companies with not aligned emissions reductions.


ESG score improvement


No Lower than parent


ESG/Climate data quality cap


weight of non-disclosing carbon companies 1.1x parent weight cap

ICB bank sub-sector companies capped at parent weight


Data providers


ISS

S&P Global ESG, S&P Global Trucost, Sustainalytics

FTSE, TPI, Sustainalytics

MSCI

MSCI

Portfolio construction


Minimise active weights

Minimise proportional active weight optimisation with country & sector penalties

Tilted

Tilted

Minimise ex-ante tracking error

Rebalance frequency


Quarterly

Annual

Semi-Annual

Semi-Annual

Sector constraint


Min(5% and half of the weight of the sector)+-
if cannot be met, constrain minimum sector weight as sum of eligible weight within the sector


5%+-


5%+- (except Energy)

Country constraint


5%+-


5%+-

Company/constituent level constraint


0.5%+- (constituent level)

2%+- (Company level)


2%+- (constituent level)

Company minimum weight


0.01% (included rather than removed)

Existing constituents: ≥ 0.01%
New constituents: ≥ max(0.01%, min(0.05,0.5 × underlying stock weight))

0.05%


Company max weight


5%

max(5%, underlying company weight)

5%


Max weight multiple


20x


20x

Effective n


25% parent


Liquidity cap


Capped at the company level based on 5 hypothetical days to sell, with 10% participation using 3-month MDVT for a 1bn USD notional


Beta constraint


0.7-1.3


Turnover constraint


5% one-way

Common factor risk aversion


0.0075

specific risk aversion


0.075

Source: S&P, MSCI, FTSE, Solactive, State Street Global Advisors, 30 June 2023.

Appendix 5: Performance Attribution Model Specification

Factor

Factor Exposure

Source

Beta

Market Beta

MSCI & Kenneth French Data Library

High minus Low (HML)

Value

Kenneth French Data Library

Small minus Big (SMB)

Small Size

Kenneth French Data Library

Robust minus Weak (RMW)

Quality

Kenneth French Data Library

Winners minus Losers (WML)

Momentum

Kenneth French Data Library

Source: MSCI & Kenneth French Data Library.  Chart for Illustrative Purposes. 

The performance attribution model is specified as:

Where rit – rft is the excess return over the risk-free rate for index i at time t, αit is alpha, βim (rmt – rft) is the index sensitivity to the MSCI World Index minus the risk-free rate, βisSBMt is the index sensitivity to the small size factor, βihHMLt is the index sensitivity to the value factor, βirRMWt is the index sensitivity to the quality factor, βiwWMLt is the index sensitivity to the momentum factor, and εit is the model error.

rit – rft= αit + βim(rmt – rft) + βisSBMt + βihHMLt + βirRMWt + βiwWMLt + εit
 

Appendix 6: Performance Attribution 1 Year

  Solactive PAB S&P PAB FTSE PAB MSCI PAB MSCI PAB Overlay Solactive CTB S&P CTB FTSE CTB MSCI Climate Change MSCI CTB Overlay
Alpha 0.0001 0 0 -0.0001 0 0.0001 0 -0.0001 0 0
Beta 0.9316*** 0.9884*** 0.9597*** 1.0092*** 0.9900*** 0.9508*** 0.9961*** 0.9673*** 1.0102*** 0.9965***
Small Size 0.1317***   -0.1288***     0.1174***   -0.1325*** -0.0937***  
Value -0.1171*** -0.1755*** -0.1597*** -0.1299*** -0.0713*** -0.0550*** -0.0899*** -0.1372*** -0.2150*** -0.0332***
Quality         -0.0363** 0.0519***     -0.1036***  
R-squared Adj. 0.9888 0.9941 0.9814 0.9891 0.9957 0.9928 0.9965 0.9835 0.9862 0.999
N.obs 256 256 256 256 256 256 256 256 256 256

Source: FTSE, Solactive & Kenneth French Data Library.  Data as of 31st July 2023.  Chart for Illustrative Purposes.

Appendix 7: Performance Attribution Live History

  Solactive PAB S&P PAB FTSE PAB MSCI PAB MSCI PAB Overlay Solactive CTB S&P CTB FTSE CTB MSCI Climate Change MSCI CTB Overlay
Alpha 0 0 0 0 0 0 0 0 0 0
Beta 0.9504*** 1.0046*** 0.9584*** 1.0028*** 0.9991*** 0.9575*** 1.0119*** 0.9617*** 1.0097*** 0.9993***
Small Size 0.1053*** 0.1458 -0.0838***     0.0765***   -0.0868*** -0.0382***  
Value -0.0680*** -0.1458*** -0.0576*** -0.1020*** -0.0432*** -0.0223*** -0.1196*** -0.0395*** -0.1394*** -0.0185***
Quality 0.0738***   0.1112***     0.0702***   0.1129*** -0.0311***  
Momentum -0.0253***   -0.0473*** -0.0263*** -0.0158*** -0.0184*** 0.0171*** -0.0487*** -0.0349*** -0.0086***
R-squared Adj. 0.9889 0.9911 0.9813 0.9891 0.9955 0.9934 0.994 0.9832 0.9934 0.9991
N.obs 445 555 452 710 538 618 555 452 1061 538

Source: FTSE, Solactive & Kenneth French Data Library.  Data as of 31st July 2023.  Chart for Illustrative Purposes.

Appendix 8: Performance Attribution Since 31st December 2016

  Solactive PAB S&P PAB FTSE PAB MSCI PAB MSCI PAB Overlay Solactive CTB S&P CTB FTSE CTB MSCI Climate Change MSCI CTB Overlay
Alpha 0 0 0.0000* 0 0 0 0 0 0 0
Beta 0.9580*** 0.9931*** 0.9755*** 0.9938*** 0.9893*** 0.9640*** 1.0068*** 0.9788*** 1.0072*** 0.9962***
Small Size 0.1173*** -0.0701*** -0.0738*** 0.0198**   0.0788*** -0.0567*** -0.0590*** -0.0376***
Value -0.0526*** -0.1162*** -0.0524*** -0.0897*** -0.0397*** -0.0124*** -0.0886*** -0.0273*** -0.1335*** -0.0167***
Quality 0.0825*** 0.0890*** 0.0207*** 0.0696*** 0.0863*** -0.0337*** 0.0067**
Momentum -0.0273*** -0.0222*** -0.0212*** -0.0322*** -0.0194*** -0.0176*** -0.0282*** -0.0325*** -0.0110***
R-squared Adj. 0.9921 0.9931 0.9893 0.9933 0.9971 0.9952 0.9954 0.9907 0.9937 0.9994
N.obs 1702 1702 1702 1702 1702 1702 1702 1702 1702 1702

Source: FTSE, Solactive & Kenneth French Data Library.  Data as of 31st July 2023.  Chart for Illustrative Purposes.

More on ESG