Investor Sentiment: Institutional Fixed Income Flows and Holdings
This data captures behavioural trends across tens of thousands of portfolios and is estimated to capture just over 10% of outstanding fixed income securities globally.
Even as rate cuts accelerated across many economies, yields were on the backfoot as inflation is proving stickier than expected, while U.S. growth continues to surprise to the upside. This was clearly reflected in Treasury prices, with 10-year yields 100 bps higher since the Fed stated cutting rates in September. And while the economic dynamics are different across different economies, the re-pricing of the U.S. rates complex proved a catalyst to sell most other developed and emerging sovereign bond markets. We therefore ended the 4th quarter on a down note for most of the fixed income complex, although higher income asset classes were able to withstand the worst of the widening.
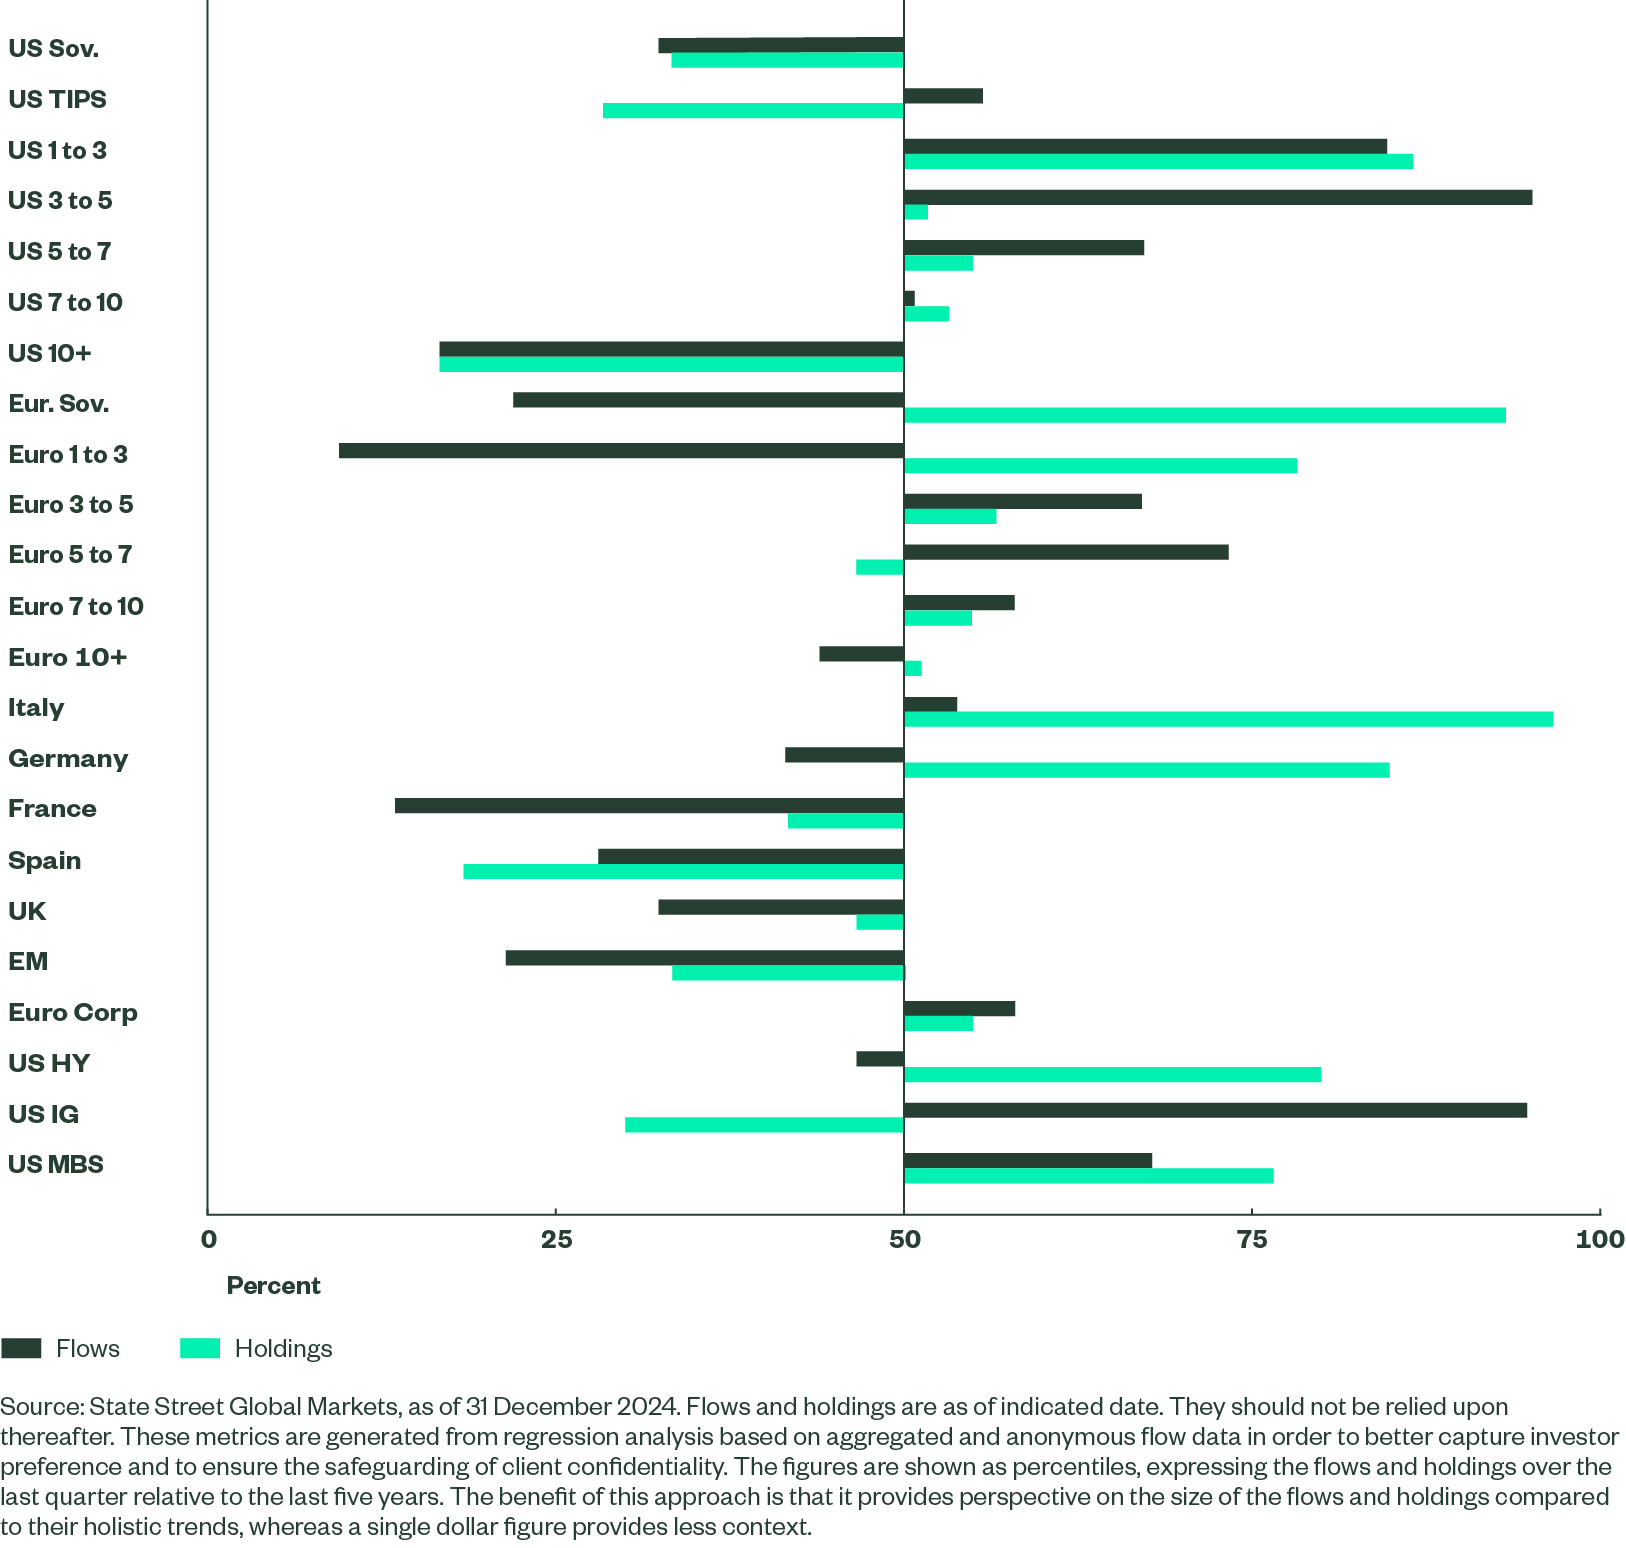
As the chart demonstrates, long-term investor flows into sovereign fixed income were generally weak at the end of the quarter across most geographies. And while Treasuries still struggled with net selling, there are signs that investors are starting to buy the dip. Looking at Treasury activity at a maturity level shows strong interest in the short end, while the long end has moved towards neutral over the course of the quarter. The same cannot be said of most European government bond markets, which are seeing net investor outflows after the ECB cut rates four times last year. Some of the sectors that are seeing renewed interest benefit from either higher income levels or reasonable duration exposure, such as corporate bonds and mortgage back securities.
Figure 1: Q4 Flows and Holdings
Treasuries Trying To Find a Floor
It has been a rough end of year for Treasury investors, with stronger growth and inflation throwing the Fed’s rate normalization plans into the wind. The potential inflationary effects of tariff and immigration policies from the incoming administration has simply added fuel to already smouldering concerns facing bond investors. And while the FOMC theoretically cannot factor in yet to be established fiscal policies into its rates outlook, the hawkish pivot so soon after it started cutting rates speaks to the uncertainty that the strong economy and unconventional political environment has created. For instance, since cutting rates by 50 bps in September, the Fed’s rates outlook for 2025 went from quarterly rate cuts to semi-annual expectations. And while this change largely matched market expectations, it optically reverses all of the bravado that going large in September had attempted to convey. As we write this, the market is now only confident that we will see one more rate cut this year, a fairly narrow margin of error that can easily be altered to signal that we are already at the end of policy normalization process.
Rates have subsequently been under pressure, as 10-year yields have risen by 100 bps since the Fed started cutting rates. Our investor flows have shown these concerns, moving into a net selling position in August, while remaining below the 50th percentile since then. Most recently, selling has slowed, as overall flows have moved back into the 40th percentile. Looking at our indicators from a maturity level shows that real money investors are tentatively moving back into duration, while the short end is still showing the greatest investor interest. The belly of the curve however remains net sold in both short and intermediate time frames, suggesting that concerns remain over the path for inflation and potential issuance trends.
Figure 2: Treasury Flows Start to Show Selective Dip Buying

Weak Flows for Both Developed and Emerging Market Bonds
Higher yields are by no means limited to the Treasury market, with the global aggregate falling over 2% in December, outpacing the losses experienced by the both the U.S. aggregate and Treasury index. For sure, the 30 bps increase in 10-year Treasury yields since the Fed cut rates last month has been largely replicated by most developed sovereign bond market and many of the larger local currency emerging markets. Most of these bond markets have also seen their curves steepen, although it has been a mixture of rising term premiums and hotter inflation expectations, which stands somewhat in contrast to U.S., where the bear steepening has been notably driven by rising real yields.
The reticence to add to fixed income exposure is evident in our asset allocation data, which shows fixed income exposure at its lowest point since the GFC, with investor’s maintaining their overweight in equity exposure. From an investor flow perspective, what had been a nascent recovery of flows into emerging market sovereign bonds at the start of the quarter has since reversed, and relative interest in both emerging and developed market sovereign bonds are now at just the 1st quartile. And while recent trends have seen improving DM flows, they remain relatively weak, although should continue to stabilize if recent activity into Treasury securities remains positive. In contrast, all of our emerging market metrics are showing weakening flows across the four EM regions that we track, with outright net selling based on shorter term measures. Given that widespread tariffs may prove to be particularly challenging for EM economies, there trends may continue until there is better clarity on the priorities of the incoming Trump administration.
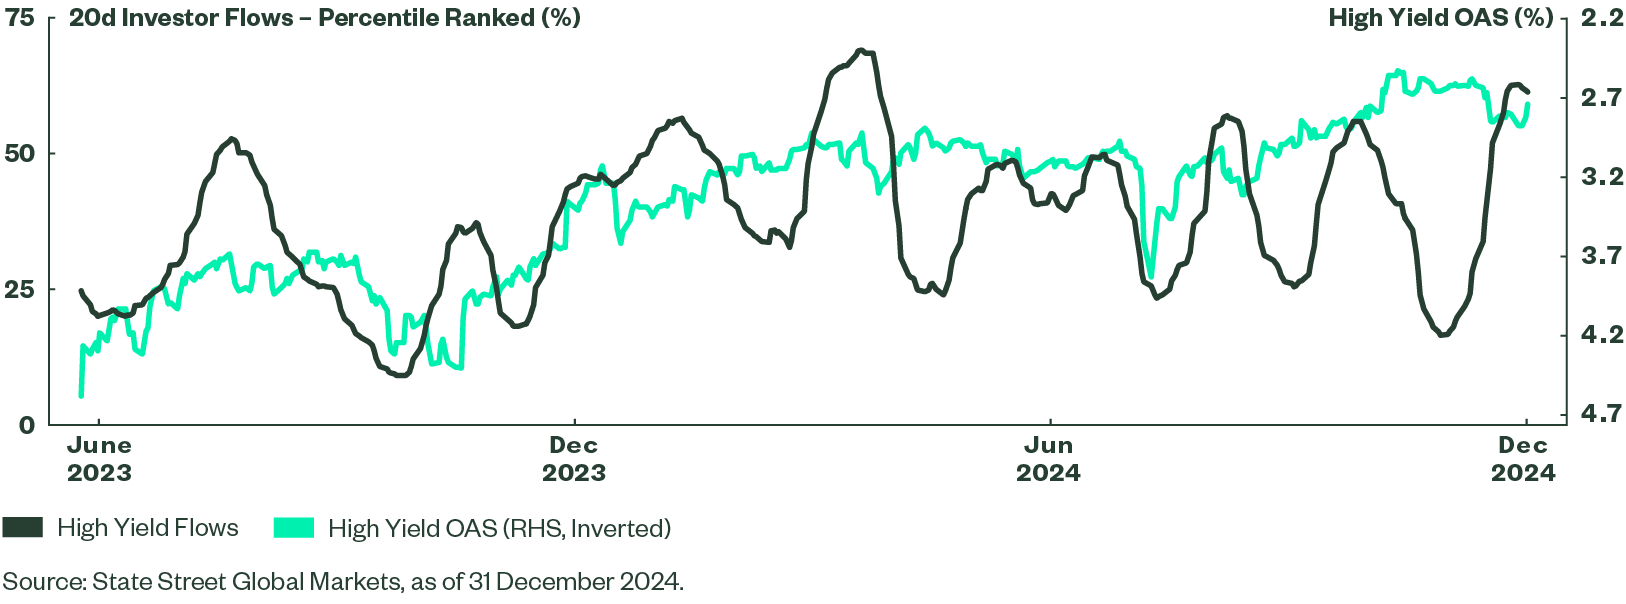
Rising High Yield Risk Appetite
High yield bonds are often more closely correlated with the equities rather than sovereign bond markets. It’s therefore no surprise that high yield was the strongest performing major fixed income asset class last year. With an average maturity under 5-years, high yield bonds avoided much of the duration led volatility that plagued many other bond asset classes. And while credit spreads recently bounced off levels last seen over a decade ago, the average overall yields still exceed 7%, after averaging over 7.8% in the 1st half of 2024. Concerns over higher refinancing costs also have not daunted either buyers or primary market sellers, with issuance increasing 60% from prior year levels, despite compressing spreads and the overall declines in yields.
With spreads still near decade tights, high yield investors are faced with the same valuation questions that most risk investors are asking, mainly whether it is time to fade the recent rally. From an investor flow perspective, we continue to see investor buying, with flows increasing steadily over the past month to a current level in the 65th percentile. These are the strongest flows since last spring when the Fed had been expected to start its cutting cycle. And while Fed expectations have turned decisively hawkish, much of this shift has been based on improving economic prospects. Overall fixed income asset allocations remain near their historic lows, although we have seen improving levels into bonds, mainly at the expense of falling cash levels. With recession odds remaining low, stable and high income continues to support positive investor flows.
Figure 4: Improving High Yield Flows