Pessimistic US Consumers May Have A Point, After All
Various recent polls and sentiment surveys have conveyed a sense of deep pessimism among US consumers that is not validated by headline economic data. Are US citizens simply mistaken, or are their pain points not appropriately captured by core macro statistics?
We discuss various parts of the consumer reaction function that help explain the divergence between consumer sentiment and some important pieces of macro data. We also give thoughts on what this disconnect may mean for consumer and voter behavior.
Why Consumers Are Still So Glum
In recent years, there has been important nuance between two major sentiment surveys—the University of Michigan and the Conference Board—leaving market participants to try to reconcile the differences (see shaded box below). Occasionally, though, a poll comes along with findings so far out of line with the hard data that it raises deeper questions about what surveys are missing and about just how uninformed respondents themselves are proving to be. A recent Harris poll was just such a case. It found that:
- 56% of respondents believe the US is in recession.
- 49% believe the S&P 500 stock market index is down for the year.
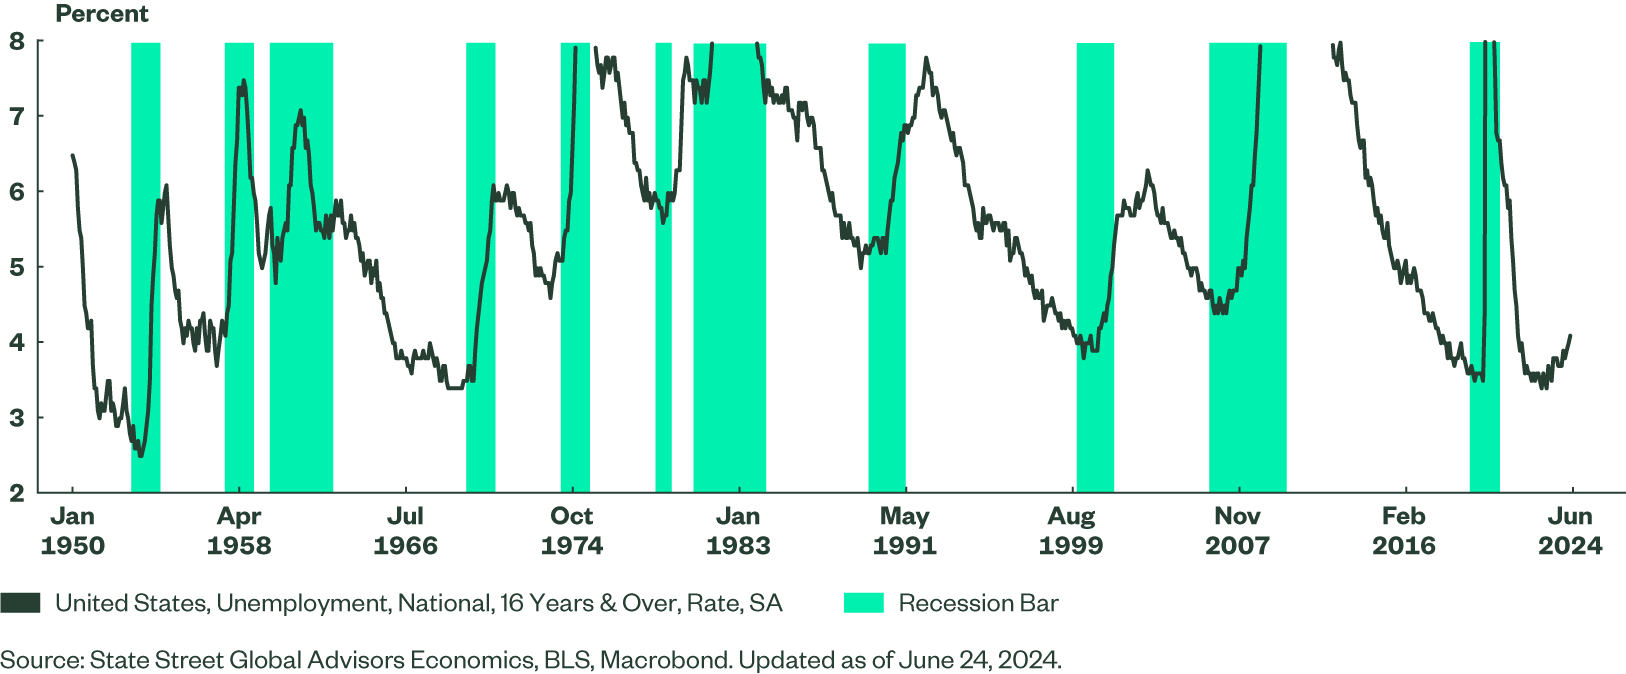
- 49% believe that unemployment is at a 50-year high.
Every one of these perceptions is factually wrong, so how do we reconcile them with reality?
The Sting of Inflation
Most observers point to the surge in inflation post-COVID as the main culprit for consumers’ bleak survey responses. Nobody likes high inflation. Personal income has more than kept up with rising prices in the aggregate (Figure 1), but that fact remains deeply underappreciated by consumers.
Still, now that headline inflation is back in the low 3.0% range (having peaked at 9.1% in June 2022), why haven’t consumers responded more positively to this progress? Digging into the various facets of consumers’ economic experience of the past few years offers some important insights. While aggregate incomes have indeed more than kept up with aggregate inflation, wage and salary income has barely kept pace with the rising costs of necessities such as food (Figure 2). On a per capita basis—which is how survey respondents assess conditions—wage growth has not kept up with food inflation. Consumers may be onto something, after all!
Figure 2: US Personal Income Growth Has Kept Up with Cumulative Inflation, but Not Sharply Higher Food Prices

Hitting Home
Meanwhile, housing affordability hovers near four-decade lows. Given that food and shelter are basic needs, the message here is that affording basic necessities has become more of a struggle. This is true for the average consumer, but even more so for the lower-income consumers. These expense challenges for low-income households also helps explain why—despite a very low 4.0% unemployment rate—credit card and auto delinquencies have risen (Figure 3).
Slight Uptick in Unemployment
The most puzzling finding in the Guardian/Harris poll was the broadly shared belief that the unemployment rate is at multi-decade highs. In fact, the opposite is true (Figure 4). Yet even on this front, the marginal erosion in employment experienced over the last year is now approaching a degree that has signaled recessions in the past. Hence, it may not be wise to entirely dismiss consumers’ gloomy mood as a fiction of their own imagination. This is also why we’ve been advocating for a calibration lower in interest rates from the Fed as an effort to preserve the “soft landing” economic trajectory.
Figure 4: Upturns in the Unemployment Rate Have Prefaced Recessions
Differences in Major Sentiment Surveys
Softness in the University of Michigan (UM) consumer sentiment survey has been a steady feature of the post-COVID recovery, but it stands in contrast to better readings from the Conference Board (CB) survey. This divergence reflects UM’s heightened sensitivity to inflation versus CB’s higher correlation to labor market conditions. As such, this divergence has been both largely acknowledged—and largely ignored—by economists.
See chart below.
The Bottom Line
What does this weak consumer sentiment mean for the economy? We strongly believe that sentiment metrics are secondary to the actual performance of disposable incomes. Unfortunately, real personal disposable income has grown at a tepid rate of 1.3% y/y during the first five months of 2024, so pessimistic views of the economy are likely to result in lower spending at this point. This is why we had been favoring a “sooner rather than later” start to the Fed’s rate cutting cycle in order to avoid turning the soft landing into a recession (see 2024 Mid-Year Global Market Outlook).
Only time will tell how the gloomy sentiment will impact the US election cycle. Consumers’ economic perceptions vary considerably depending on their political affiliation, yet the clear downshift in independent voter perception is notable (Figure 5). The combination of dismal thoughts on the economy plus a surge in independent voters both speak to a desire for “change” in leadership, regardless of how accurately the blame is assigned for perceived economic challenges.
Figure 5: Party Affiliation Drives Sentiment, but Independents Gloomy
