Gold 2024 Midyear Outlook: Three Drivers at the Helm for Gold
Backed by central bank purchases and robust investment demand from China, gold has demonstrated strong momentum this year. But we believe a third driver could add to gold demand: a shift in the macro environment in light of a crowded geopolitical risk calendar.


Backed by significant central bank purchases and robust investment demand from China, gold has demonstrated strong momentum this year and rallied 14% through the end of May.1 Interestingly, this rally has occurred alongside macro factors that typically present headwinds: rising US rates, a strengthening US dollar, and limited cross-asset volatility.
The divergence from macro pressures suggest secular drivers, namely central banks’ desire to diversify their reserves and the increase in demand from China, provided resilience in light of those counterbalancing macro trends.
We don’t see any change in the persistency in these two secular drivers. What’s more, we see a third driver going forward: a potential shift in the macro environment in light of a crowded geopolitical risk calendar (including evolving Federal Reserve (Fed) policy, US elections, the Russia/Ukraine war and conflicts in the Middle East). Gold’s potential upside remains bright.
Therefore, we see three drivers for gold for the rest of the year:
- Central bank gold buying resiliency
- China’s insatiable appetite for gold
- Macro event risks rising, sparking strong investment demand for gold
Looking Back to Move Forward: Gold Performance so Far in 2024
Gold started the year at US$2,063/oz, a level where it had found resistance in recent years (August 2020, March 2022, May 2023).2 This time around, however, it broke through that barrier and reached an all-time high of US$2,427/oz on May 21, 2024.3 In fact, gold prices have rallied by almost 4% since the start of April — a rally driven by further evolutions in Fed policy and the ensuing slight uptick in cross-asset volatility.4 This illustrates how the volatility complex plays a role in gold’s short-term performance.
This gap between short-term macro-based spikes and sustained upward trends in gold prices, however, is largely driven by incremental secular demand for the yellow metal. This phenomenon has precedent. It was particularly evident during the 2000s when gold prices surged 275%.5 And during those periods, gold price returns had staying power. The rolling three-year return was positive for 140 consecutive months with an average 16% annualized return (Figure 1).
While there were other macro factors during the 2000s, like a declining dollar and geopolitical risk events, there was substantial economic growth in emerging markets, notably China and India, which spurred increased demand for gold jewelry, coins, and bars. And today, once again, growth in emerging markets is underpinning a structural rally in prices.
In China, there has been robust consumer interest in locally listed gold ETFs, physical gold bars, coins, and jewelry. The People’s Bank of China (PBOC) has been a key player over the last decade in improving local sentiment toward gold. The PBOC’s accumulation of over 1,664 metric tons of gold since 20096 has fostered more avenues of strategic gold demand.
Central banks have also aided the demand trends supporting prices today — a unique difference relative to the early 2000s. Their impact is largely from direct purchases of gold to diversify their reserves from traditional fiat currencies. This trend continued strong in the first quarter of 2024, with a total of 291 metric tons added.7 This healthy start to the year supports our view that central bank demand will remain additive in 2024.
Central banks can also impact gold demand through policy actions. The prospect of higher for longer rates from the Fed has coincided with outflows from gold-backed ETFs. These outflows contributed to 739 metric tons in supply since Q2 2022.8
Some of this is due to a gold recycling trend: high prices incentivize investors to lock in gains and reposition elsewhere — namely high beta growth stocks based on fund flows.9 This recycling trend increased in Q1 2024 as gold prices rose, yet this behavior from ETF investors is anomalous.
Since the inception of gold-backed ETFs, the direction of flows has trended upward in line with the direction of gold prices. For example, the last time gold-backed ETFs experienced eight consecutive quarters of outflows was from Q1 2013 to Q4 2014, when a total of 1,091 metric tons were redeemed.10 Back then the price of gold fell by 28%.11
The difference in performance from one period to another highlights how gold supply and demand dynamics have changed. Understanding these dynamics is essential for investors seeking to navigate the gold market and capitalize on opportunities presented by price fluctuations.
For now, the current divergence from gold’s typical response to US macro conditions over the past two years suggests that focusing more on secular non-macro demand dynamics could provide better insights into the future direction of gold prices. If risk-asset volatility (e.g., equity and credit markets) does spike, it could be a more forceful driver of gold’s near-term performance.
First Driver: Central Banks
Last year marked the 14th straight year of net central bank buying.12 Central banks’ gold usage for reserve management and diversification has increased as they have sought to reduce over-concentrations in current global reserve currencies (FX reserves) like the US dollar and the euro.
There was a spike in demand after Q1 2022 when Russia’s invasion of Ukraine resulted in Western nations imposing heavy economic sanctions on Russia (Figure 2). Russia’s international reserves were also effectively frozen when Russian financial institutions were removed from the Society for Worldwide Interbank Financial Telecommunications (SWIFT) system. The realization from the international community, particularly among non-US allies, that their US dollar or euro reserves can be weaponized, has resulted in an increased desire to hold gold as a reserve asset.
In fact, the biggest investor barrier to gold has always been that it doesn’t pay a coupon, but that’s also the feature that allows gold to be fully owned by the investor since gold does not depend on the creditworthiness or promise of a third party. After all, fiat currencies are essentially promissory notes issued by governments or central banks.
Year-to-date, major gold buyers were all from emerging markets, led by Turkey (30.1 metric tons), China (27.1 metric tons), and India (18.5 metric tons).13 China’s Central Bank continues to significantly ramp up gold reserves to diversify its FX reserves.
Despite the significant purchases by the PBOC in the past 18 months, China’s current gold reserves as a percentage of its total FX reserves remains quite low at 4.6%.14 Other developed and emerging market central banks hold a higher percentage, averaging 60% and 20%,15 respectively, of gold reserves in their total FX reserves. This indicates there is potential for China to purchase more to align its reserve makeup with other similar central banks.
These increasing needs for emerging market central banks to diversify their FX reserves may provide key support for gold prices heading into the second half of the year.
Second Driver: Chinese Consumer Demand
Chinese investors and consumers have historically shown a strong preference for investing in gold, driven by cultural, economic, and strategic factors. Culturally, gold has been deeply ingrained in Chinese traditions and customs, symbolizing wealth, prosperity, and good fortune. This cultural affinity has been reflected in the high demand for gold jewelry and ornaments, especially during festival and significant life events such as weddings.
Economically, gold has served as a reliable store of value, particularly in times when there are fears of currency depreciation, economic uncertainty or volatility. And those economic traits have been reflected in a plethora of macro events restraining local economic momentum, such as:
- The Chinese property market, once a pillar of economic growth, has become a source of concern (e.g., overleveraging risks as illustrated by Evergrande’s near collapse)
- China’s export-driven growth model has come under pressure, as the global shift toward re-shoring and self-sufficiency has led many countries to diversify their supply chains, reducing dependence on Chinese exports
- Chinese government’s regulatory approach has introduced significant uncertainty for investors and entrepreneurs, evidenced by the high-profile actions against companies like Alibaba and Didi
These economic challenges collectively led to increased gold demand in 2023 and that same momentum has carried into the first half of 2024. This strength in demand has resulted in the Shanghai-London gold price premium to average US$31.6/oz since 2023, compared to the 2015-2019 average of US$7.8/oz16 (Figure 3). Reflecting the average record price premium of US$39/oz in Q1 2024, China’s physical gold and coin demand spiked 68% year-over-year (YoY) during the quarter to 110 metric tons, the strongest total for more than seven years.
Figure 3: Gold Price Premium in China Reflects Increase of Local Gold Demand
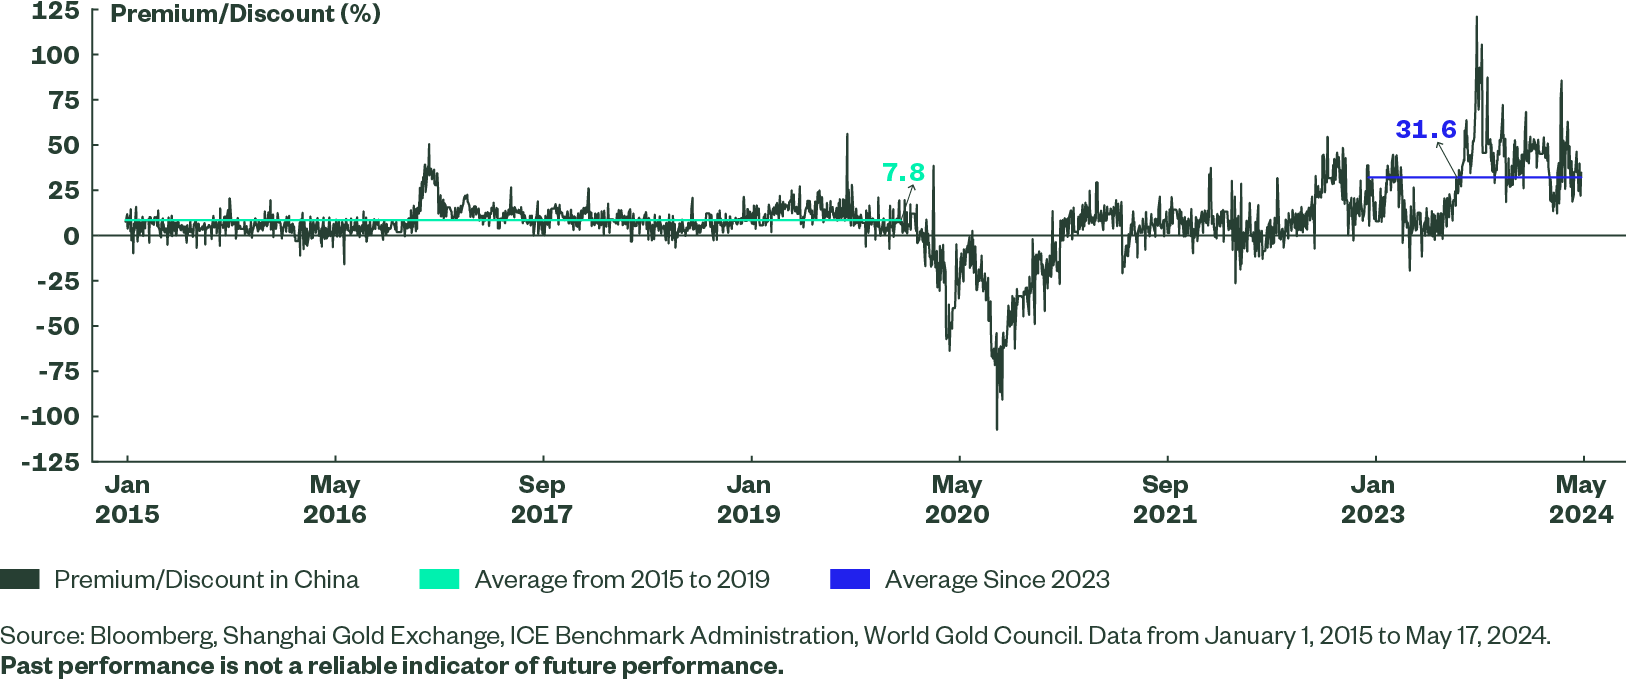
With restrictions on foreign investments, relatively underdeveloped financial markets with increasing volatility, a real estate market facing many challenges, and local currency depreciation, gold has been viewed as a perceived safe-haven* asset and reliable investment vehicle. As a result, investors should monitor the gold premiums closely (any reversion to long-term means) and China’s physical gold and bars demand in the coming quarters, as they may serve as solid indicators of when demand from China might start to slow or accelerate further.
Third Driver: Global Macroeconomic Landscape Grows More Fragile
The US economy, aided by massive amounts of fiscal stimulus, continues to defy consensus expectations for a meaningful slowdown. Instead, the mid-May Federal Reserve Bank of Atlanta GDPNow forecast now estimates that annualized real GDP growth for the second quarter will be a robust 3.6%.17 At the same time, several major economies including the United Kingdom, Europe, Japan, and China are emerging from recent bouts of weakness.
Nonetheless, that positive backdrop of determined fiscal and monetary policies and steady economic growth has combined with strong labor markets, growing corporate profits, and healthy consumer spending to create an attractive atmosphere for risk assets. And much of this favorable environment for risk taking is already reflected in stretched valuations and high asset prices. Many stock markets around the world are at or near all-time highs, credit spreads are historically tight, and most measures of capital market volatility are remarkably subdued.
Looking ahead, market volatility will likely be impacted by the fact that more than 40% of the world’s population is eligible to vote in an election this year.18 November’s US presidential election promises to be one of the closest and most divisive races in US history. Investors should brace themselves for greater election headline risks. Based on implied measures of tail risk, the range of outcomes has been rising (Figure 4).
Meanwhile, the probability of a monetary policy mistake has been rising, too. Central banks are desperately trying to find the right balance between inflation and economic growth — all before election noise makes it difficult to meaningfully implement policy decisions.
If central bankers cut interest rates prematurely, they risk repeating the stop-and-go monetary policy mistakes of the 1970s that enabled inflation to come roaring back. If they wait too long, central bankers risk producing an unwanted recession, capital market catastrophe, or possibly both. Regrettably, central bankers find themselves in an unwelcome Catch-22 situation.
This is all occurring as ballooning fiscal deficits increase the supply of sovereign debt while demand is falling and central banks lower their purchases for Treasury securities. This likely has contributed to higher and more volatile interest rates than many market participants had anticipated and could destabilize the global economy and result in a stock market correction.
Furthermore, geopolitical tensions in the Russia-Ukraine war, Middle East conflict, and friction between the US and China over Taiwan could damage the global economy and bolster inflation. Rising trade protectionism — like the recent increased tariffs on Chinese imports from semiconductors, solar cells and medical products — likely will hurt the global economy and result in higher prices.
The potential for stubborn inflation is possibly the greatest risk to macro stability, but also one of the largest potential opportunities for gold prices moving forward. Gold offers low correlations to both stocks and bonds along with a historical trend of preserving purchasing power during periods of above-average inflation.19
Where to Source Gold in Portfolios
In a more volatile macro environment with higher interest rates and sticky inflation, a different mix of investments may be needed in a diversified portfolio to enable investors to reach their long-term goals and objectives.
Long duration Treasurys, for example, haven’t provided the expected diversification benefits or added protection that many investors anticipated this year. In fact, for the first time ever, long duration Treasurys have delivered negative performance in the 10 months following the last Fed rate hike in July 2023. Long duration Treasurys have experienced a notable drawdown since August 2020 and have delivered virtually no return since 2012.20
Including more real assets in a diversified investment portfolio could be an increasingly attractive option for investors. Building a 5-10% real assets allocation, drawing equally from stocks and bonds and/or funding it from elevated cash balances, could help further diversify portfolios. It could also better prepare them for today’s secular drivers amid the cyclical drivers of macro volatility, higher interest rates, and an inflationary environment.
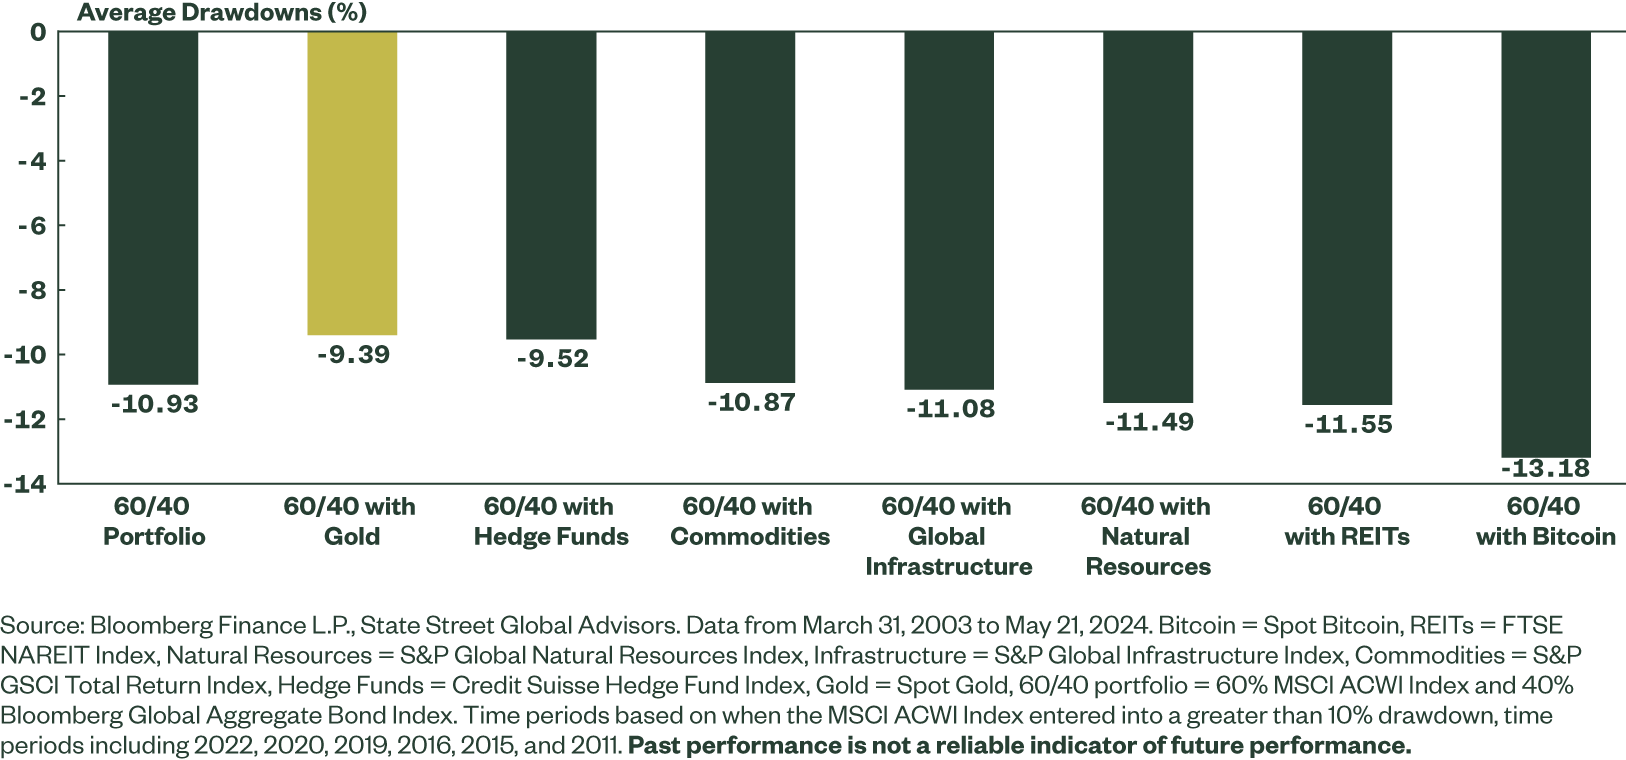
In that 5-10% allocation, investors may seek liquid alternative asset classes such as real estate investment trusts (REITs), natural resources, global infrastructure, liquid hedge strategies or broad commodities. This would potentially help investors mitigate risk in a traditional 60/40 portfolio. Yet gold, the original liquid alternative, has historically shown it may serve portfolios more effectively given its diverse demand drivers.
This aspect of persistent downside risk mitigation is on display in Figure 5, illustrating that each time equities dropped more than 10% over the last decade, a 10% portfolio allocation to gold would have reduced portfolio drawdowns by 154 basis points (bps) on average compared to a traditional 60/40 portfolio. The same allocation to most other liquid alternatives would have had the opposite effect — increasing average drawdowns.
Figure 5: Gold Reduced Drawdowns During Times of Market Stress
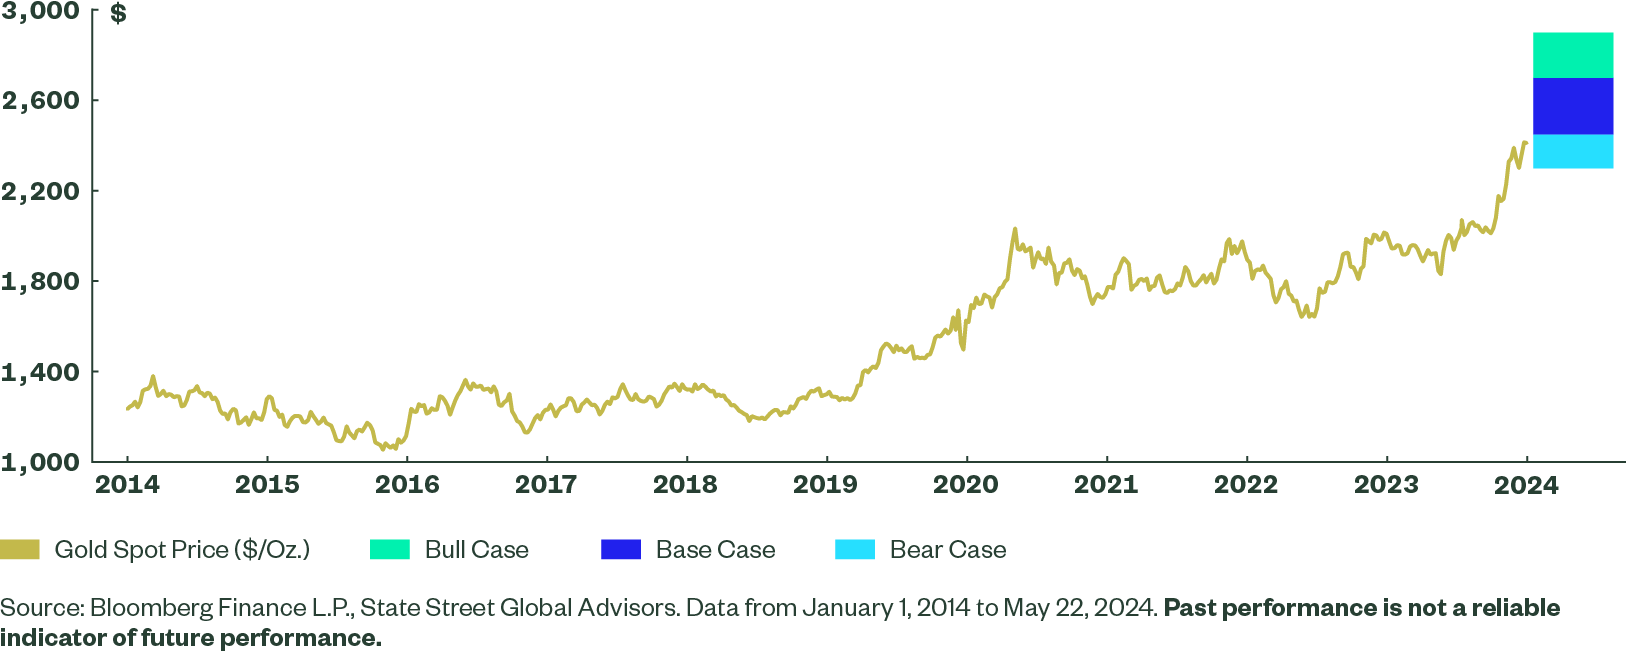
2024 Midyear Gold Outlook Potential Scenarios and Trading Ranges
- Base Case (50% Probability): Gold sees a potential trading range between US$2,200/oz and US$2,500/oz.
Consumer demand for gold in emerging markets remains steady at current levels, supported by continued robust central bank gold buying. Increasing market volatility from current geopolitical events in the Middle East, Russia/Ukraine and the US presidential election lead investors to increasing gold allocations to manage risks.
Meanwhile, despite the macro headline risks, global and US growth continue to surprise to the upside, limiting rate cuts by the Fed. Declining real interest rates in the US and a weakening US dollar provide support to gold. - Bull Case (30% Probability): Gold sees a potential trading range between US$2,500/oz and US$2,700/oz.
China matches and/or exceeds last year’s 5% GDP growth target that boosts household incomes, leading to gold consumption via ETFs, bars, coins, and jewelry. At the same time, central banks’ annual gold consumption comes in substantially above the 5-year average of 686 metric tons21 as recent trends get amplified by geopolitical risks.
On the macro front, risks materialize more. High equity valuations lead investors to scrutinize earnings reports for any signs of weakness or future risk. This leads to increased volatility against a crowded macro calendar that introduces elevated uncertainty and increasing demand for safe-haven* assets. The return of global gold ETF net inflows synchronizes with rising COMEX money net gold positions, robust retail physical gold demand, and central bank buying to provide support to gold. - Bear Case (20% Probability): Gold sees a potential trading range between US$2,000/oz to US$2,200/oz.
Robust economic growth leads to a higher-for-longer interest rate environment, as the Fed maintains elevated rates to manage inflation and sustain economic growth.
In contrast, global economic weakness prompts central banks in other countries to lower their interest rates to stimulate growth. This divergence in monetary policy creates a substantial interest rate differential that results in an increased demand for US dollars to purchase these assets, driving up the value of the US dollar and creating a headwind for demand.
Figure 6: Range of Outcomes for the Remainder of 2024 Is Skewed to the Upside