Q3 Investment Outlook
As elections around the world influence the fixed income outlook for Q3, consider the following exposures:
- High yield may continue to perform as the macro backdrop looks supportive, and convertible bonds can offer a higher quality profile
- Add duration to portfolios to potentially enhance returns as central banks have begun to deliver rate cuts
- Emerging market debt hard currency exposure while US political uncertainty is still in play and the markets await action from the Fed
Q3 2024
High Yield and Convertibles: Sustained Momentum
The high yields on offer from the high yield asset class have provided investors with several successive quarters of positive returns and a soft economic landing suggests that the relatively benign backdrop is expected to continue. Convertible bonds offer a quality upgrade from high yield, while historically low deltas highlight considerable potential upside.
High Yield Is Expected to Continue to Perform
High yield has now delivered seven successive quarters of positive returns — quite a remarkable achievement given the broader backdrop of high levels of volatility. The short duration of high yield makes it less sensitive to big swings in yield while the high coupon provides holders with strong positive carry.
From a macro perspective, the backdrop continues to look supportive. In the Midyear Global Market Outlook, we outlined our expectations for a soft landing for the US economy coupled with a further easing in inflation pressures. This implies a gradual decline in interest rates as the Federal Reserve and other central banks ease policy. Lower-rated issuers could still be vulnerable but positive growth should support earnings. Declining rates should be more favourable considering the sizeable amount of debt that non-investment-grade issuers need to roll going into 2025. Ratings momentum looks consistent with the idea of a soft landing, as there has been a greater number of downgrades than upgrades, but the ratio is well above recent lows. There is also limited exposure to the worst rated paper.1
In the Q2 Bond Compass, we highlighted the high breakeven rates for high yield, i.e., the substantial degree to which the market would have to sell off for high yield strategies to lose money. The relative price insensitivity of high yield to moves in the underlying risk-free rate means that much of the return comes from coupons, which are currently high. This has been a key factor driving positive returns over recent quarters.
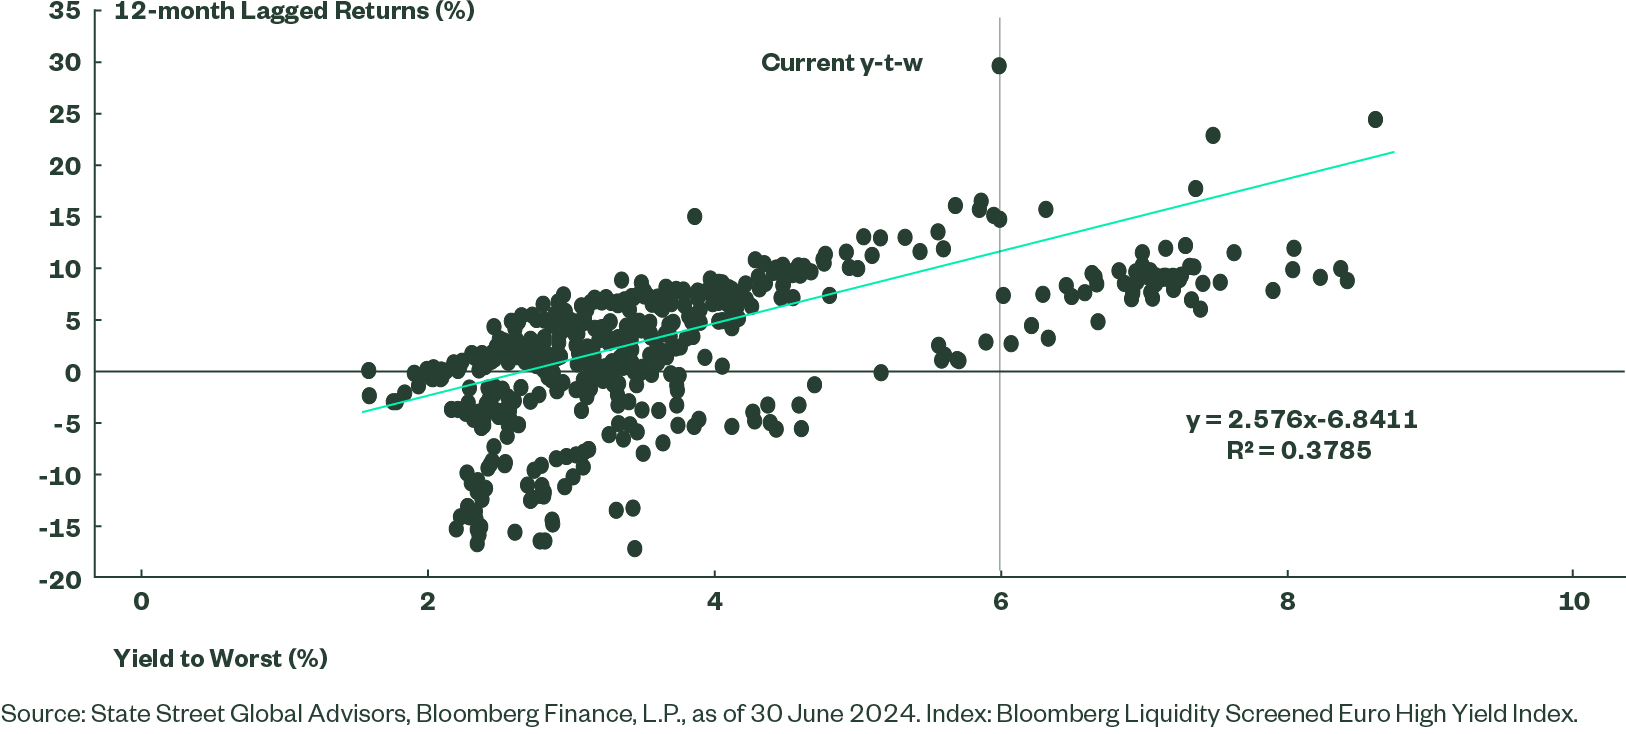
The following two figures show the dot plots of the US (Figure 1) and EUR (Figure 2) high yield index yield-to-worst plotted against the rolling 12-month returns from the indices lagged by 12 months. In other words, the 12-month total returns are shown relative to the yield at the time the investment would have been made. There is a correlation and, importantly, the 10-year history shown suggests that there have been no instances where investing at current yield levels would have resulted in a negative return.2
Figure 1: US HY Index Yield Versus 12-month Total Returns, Lagged by 12 Months
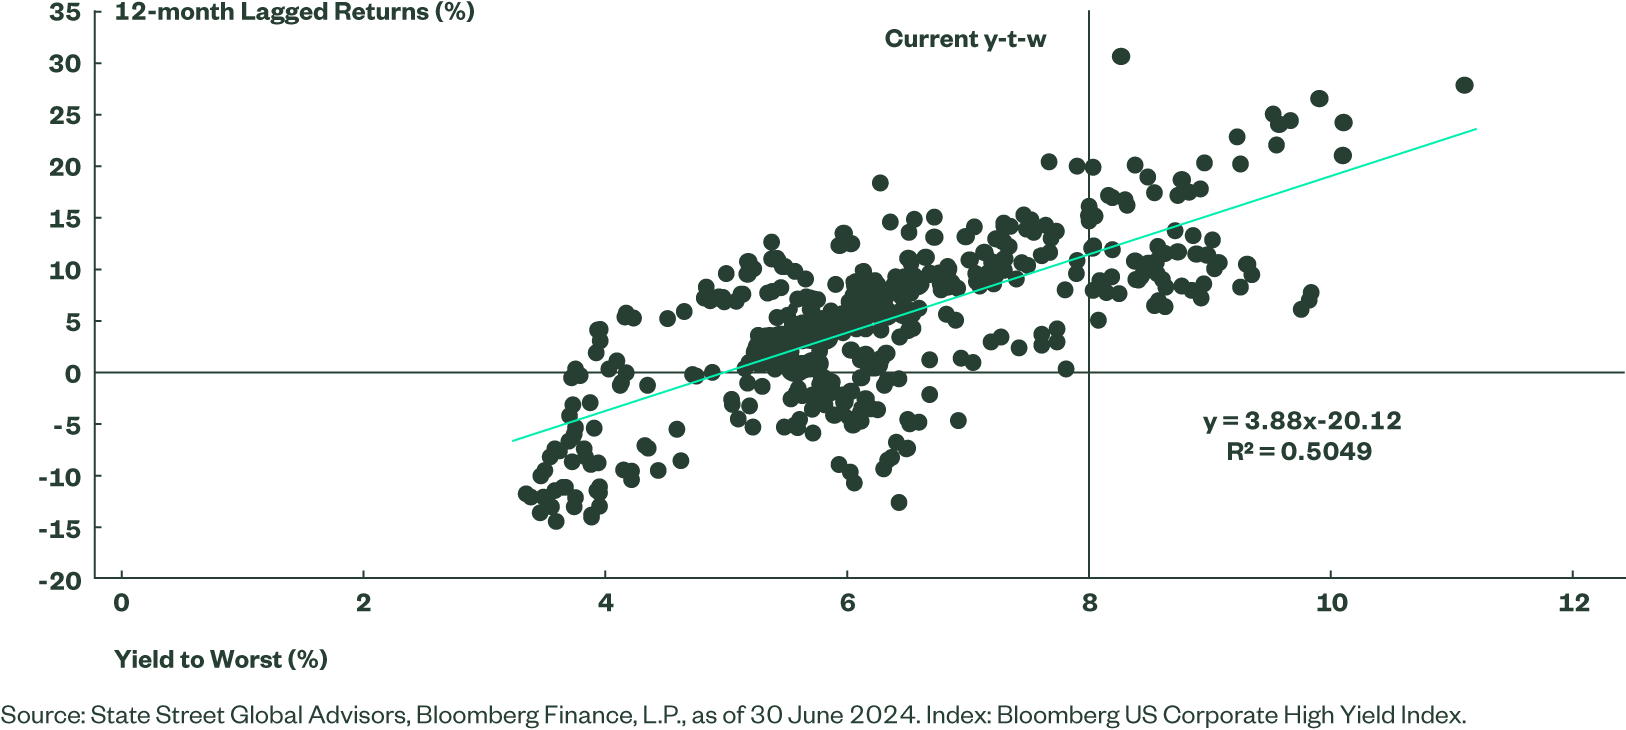
Figure 2: Euro HY Index Yield Versus 12-month Total Returns, Lagged by 12 Months
French Politics
Investors may have some concerns over the most recent political issues in France. French issuers account for around 22% of the Bloomberg Liquidity Screened Euro High Yield Bond Index, meaning this has been one factor behind the widening of euro credit spreads from their tightest levels on 7 June. Looking at the index constituents in more detail shows that French names have widened by an average of 66 basis points (bps) between the end of May and 21 June, a week after the election had been called. This is a 23% widening of spreads at the end of May, compared to a 26 bps widening for non-French bonds, the equivalent of a 10% widening. This suggests there has already been quite a material repricing of French bonds within the index.
Upgrading Quality Through Convertible Bonds
If heavily allocating to non-investment-grade issuers at what feels like quite a late point in the economic cycle does not sit comfortably, convertible bonds have shown similarly robust performance year to date, but typically have a higher quality profile. The Refinitiv Qualified Global Convertible Index consists of about 55% investment-grade paper, meaning it is more reflective of a crossover exposure.3 Being a global exposure, it is largely US-denominated paper (57.8%) and, therefore, also has more limited exposure to France (7.4%).
It has around 27.3% exposure to IT services, which may help it benefit from the ‘halo effect’ of being associated with Tech companies. They are typically smaller issuers, so could benefit in the event that market gains start to broaden out. The Refinitiv Qualified Global Convertible Index is strongly correlated to returns in both small and mid caps.
From a valuations standpoint, convertible bonds do not look stretched. The delta on the Refinitiv Qualified Global Convertible Index has dipped back to 41, having reached highs of over 45 earlier in the year.4 This is below the long-term average for the index and implies that convertible bonds within the index have more ‘bond-like’ characteristics than ‘equity-like’. This signals opportunity for price gains to accelerate as the underlying stocks move above their conversion prices.
How to Play this Theme
Positioning for Easier Policy and Politics
Central banks are starting to deliver cuts. This indicates now may be a good time to add some duration to portfolios to potentially enhance returns. However, the data continues to fall into place only gradually and politically induced volatility points to remaining cautious.
The market has, at times, clearly looked overly aggressively priced for Federal Reserve (Fed) cuts in light of the persistent strength of the US economy and stickiness of inflation. In addition, the inverted term structure of rates means that, as an investor, you are not compensated for extending out along the curve. As a result, we have preferred to focus on short-maturity strategies. On the data front, there are finally hints that the economic winds are changing. The Bloomberg US Economic Sentiment Index has been in negative territory for all but one of the past 13 weeks and is close to its February 2019 lows. In addition, as outlined in the 2024 Midyear Global Market Outlook, expectations are for inflation to ease further.
Cautiously Moving Towards Longer Duration
Figure 1 illustrates the value of being longer duration as the rate cutting cycle gets underway, with the 7-10Y maturity bucket outperforming shorter exposures and even the all-maturities index (which also has a slightly shorter duration). Being long duration produces higher returns if a cut is delivered, but can be costly if it does not materialise.
Pushing the first rate cut in the cycle further into the future has been a common theme this year. Even as we enter the second half of the year, the market does not have the confidence to price two full 25 basis point rate cuts from the Federal Reserve. This underlines both a lack of conviction that the economic data falls into line and complications around the US election.
The significantly lower returns for the short-maturity bucket (seen in Figure 1) suggest it is worth moving closer to neutral market duration. The 3-7Y part of the curve looks well positioned; its performance was in line with the all-maturity exposure in the run-up to the first Fed easing in 2019. However, for 2024 year to date, it has proved more defensive, with the most extreme losses in April being -2.5% against -3.4% for the all-maturities index.
The ECB Gets the Ball Rolling
For Europe, rate cuts are already in play. The ECB took their deposit rate down from 4.0% to 3.75% at the start of June. As suggested by Figure 2, which shows the mini easing cycle undertaken by the ECB in 2011, it makes sense to extend duration as the cuts get underway. For several quarters we have been advocating neutral duration positions but through a barbell structure: short-dated investment-grade credit for yield coupled with long-maturity government exposure to add duration and convexity. This has worked well, returning 24 bps more than the all-maturity government bond index over the quarter.5
However, returns were still negative, as market pricing had been contaminated both by volatility in US markets and political issues in Europe. Only investors in the short part of the curve would have seen positive returns. Therefore, it may make sense to focus on the shorter part of the curve. As can be seen in Figure 2, the returns from the 3-5Y part of the curve kept pace with the all-maturities index during the early part of the 2011 easing cycle. It has also proved more defensive during the first half of 2024.
Bank of England Ready for Take-off
With the UK election now out of the way, the political backdrop looks more settled. Growth has rebounded after a weak end to 2023 and CPI has returned to its 2% target. The Bank of England (BoE) has the cover it needs to cut rates and two of the nine MPC members already voted to ease policy at the June meeting. That said, it is unlikely to adopt an aggressive stance given fears that CPI may creep higher into the end of the year. There is also uncertainty over growth. The new Labour government has plenty of ambition to kick-start the economy, meaning the BoE may be wary of expansionary fiscal policies. An increase in gilt supply may steepen the curve. While there are signs that the curve out to 10 years is reverting back to a steepness that is more consistent with the levels seen prior to the financial crisis, there is still some term premium rebuild that needs to occur to get there. In our opinion, given these uncertainties, it would make more sense to focus on the front end of the curve where the higher yield and shorter duration provides more protection.
How to Play the Theme
Emerging Market Debt
Volatility in the US dollar continues to support the case for emerging markets hard currency exposure — for now. However, once US political uncertainty is out of the way and the Federal Reserve (Fed) embarks on a policy easing path, the outlook for local currency exposure should greatly improve.
Hard-to-predict US Dollar Points to Hard Currency
Theme 3 of the Q2 Bond Compass revolved around emerging market hard currency debt. With US Treasury yields still high, the short-maturity ICE BofA 0-5 Year EM USD Government Bond Index returned close to 1% over the quarter. The short duration of the exposure (2.36 years) means the strategy has been fairly insensitive to the movements in US Treasuries while the coupon has provided the returns.
There is a risk that little changes over the coming quarter. Political uncertainty is likely to continue to underpin USD volatility. US growth appears to be slowing and inflation easing, but the political calendar has made the market reluctant to price in an early cut from the Fed, preferring to focus on the post-election meeting in November.
The key pushback to hard currency is that spreads to Treasuries are historically tight. While there are always idiosyncratic risks in emerging market countries, the average rating on the index is BBB, with only around 2.5% either rated below B- or not rated.6 This may not eliminate the risks of spread widening but should limit the risks of issuer defaults in the event of a broader growth slowdown.
The draw of the strategy remains the breakeven rate of over 250 basis points (bps).7 This is high from a historical perspective and implies that yields need to rise by around 250 bps before the price losses from the index offset the annual yield. This relatively large cushion is, perhaps, a reason why investors seem willing to tolerate such tight spreads to Treasuries.
Local Currency Outlook Still Hangs on the Fate of the USD
Returns for local currency exposures were around -2% in Q2. The strength of the USD proved a major drag on performance but there were also several markets, notably Brazil and Mexico, where FX weakness combined with negative bond price returns to hit performance. There were some positives such as South Africa and Turkey but these were unable to offset the wider negative returns.8
The story remains frustratingly similar: The USD looks over-valued by around 14% versus the currencies that comprise the Bloomberg EM Local Currency Liquid Govt Index.9 Real rates are firmly in positive territory (Figure 1) meaning returns are positive once adjusted for inflation, and coupon returns remain strong at over 1% per quarter.
The factors spoiling the party are clearly USD strength and correlations to US Treasuries. There is some positive news on the latter factor, as EM debt returns do appear to be de-coupling with the 12-week correlation of returns dropping to 51% by the end of June against highs of over 87% in early March. However, the USD is likely to remain volatile ahead of the US election and the uncertainties around the timing of the first rate cut from the Fed.
India Joins the Club
Indian Fully Accessible Route (FAR) bonds are starting to be included in emerging market local currency indices. JP Morgan announced its inclusion in their EM indices from end June 2024 and Bloomberg will start including them from January 2025. The size of the market means that India FAR bonds will ultimately hit the 10% cap applied to many indices. When fully incorporated, the net effect for the Bloomberg Local Government Index 10% Capped Index should be a slight increase in yield (+3 bps) and a lengthening in duration (+0.1 years).10
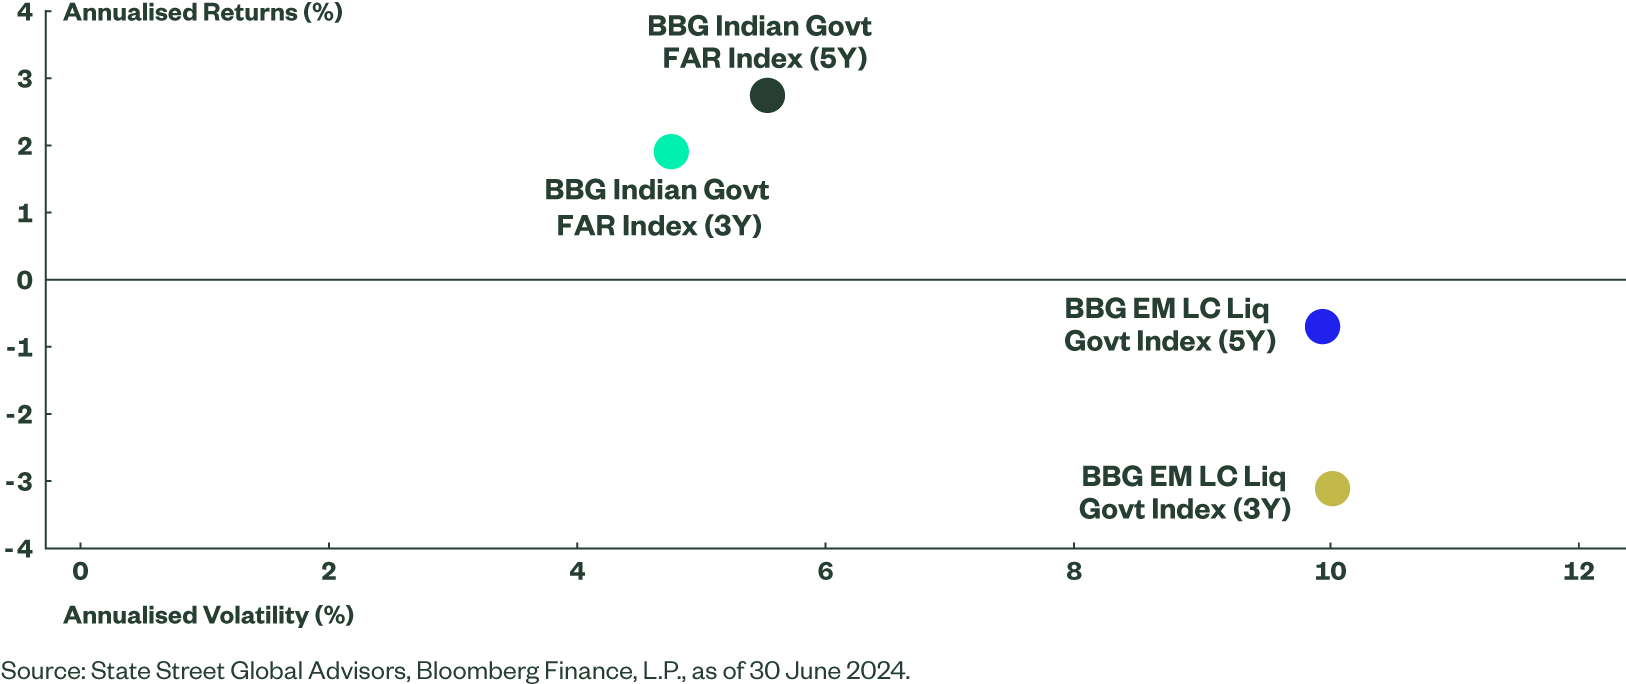
So the impact on index risk characteristics looks limited but there should be benefits from an improvement in returns and a reduction in volatility. Figure 2 illustrates this by showing the higher 3- and 5-year annualised returns and lower volatility of the Indian Government FAR Bond Index versus the Bloomberg EM Local Currency Liquid Govt Index.
Figure 2: Higher Returns and Lower Volatility from the Indian Government FAR Bond Index than for the Broader EM Index