Real Talk on Real Rates: A Data-Driven Look at the New Rate Paradigm
Following the Federal Reserve’s aggressive tightening cycle from early 2022 to mid-2023, much ink has been spilled about a reset higher in interest rates and an official exit from the previous ultra-low-rate environment. However, it’s important to look beyond nominal rates and understand the trajectory of real rates, which take inflation into account.
Real rates are arguably a truer barometer of the interest rate backdrop for businesses, consumers, and investors, and can help us determine how equity markets may respond in a new higher-rate paradigm. In this piece, we take a closer look at today’s higher real yields, what current levels mean for equity markets, and what we can expect in the future.
The Path to Higher Real Rates
Since the 1980s, US Treasury yields have trended in one direction: downward. The high yields that were commonplace in the 1970s and 1980s were a byproduct of higher inflation expectations and higher levels of economic growth. When these factors normalized to lower levels, it led to a lower neutral rate of interest — a paradigm shift of sorts — which contributed to a “lower for longer” mentality and a decline in nominal interest rates. Real yields, made up of nominal yields minus inflation, followed on this downward path. Post-Global Financial Crisis, real yields were entrenched below 2% for almost 15 years.
Today, the tide has shifted. Restrictive monetary policy has led to higher nominal yields. Meanwhile, lower levels of inflation have come into fruition, taking a smaller bite out of nominal returns and leading to higher real rates.
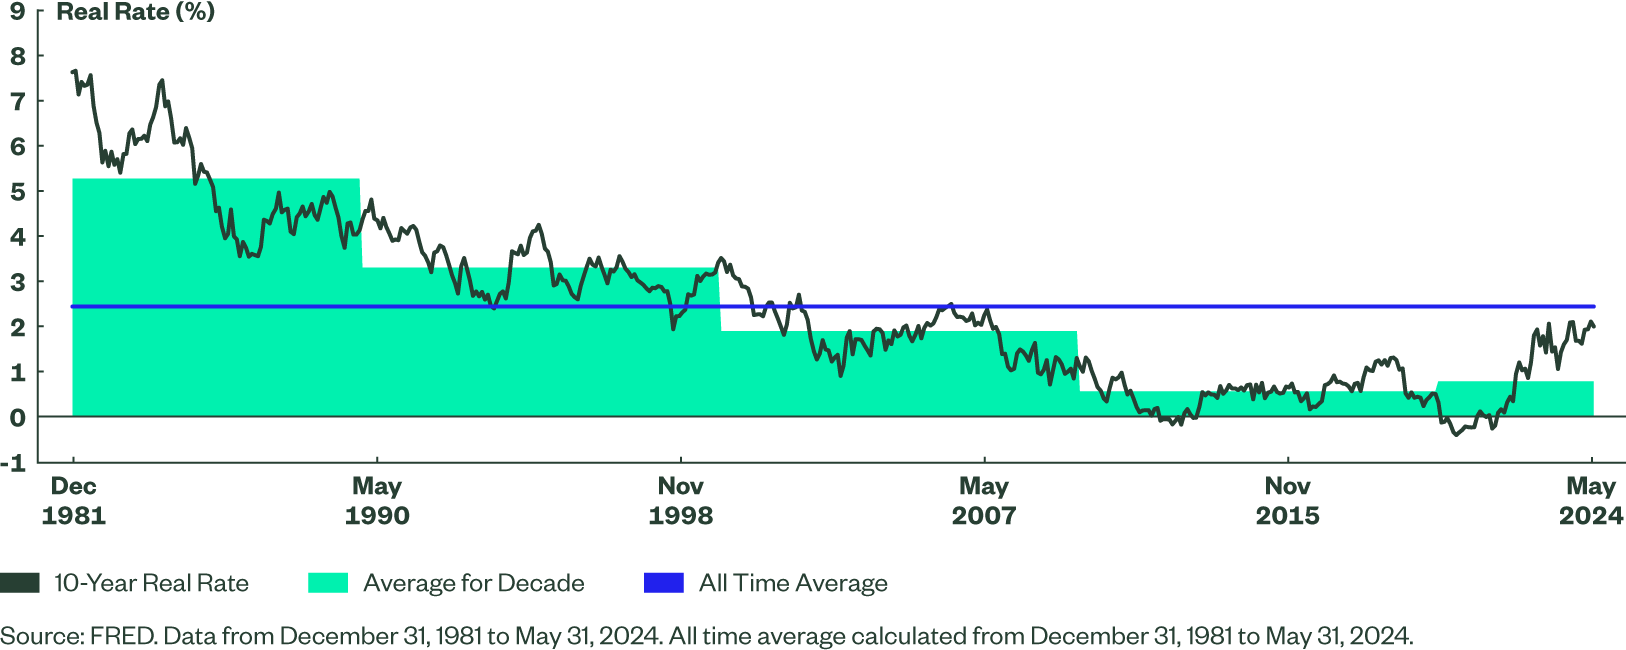
Figure 1 shows the 10-year real rate1 over time, along with average historical levels across each decade. The averages illustrate the long-running declining rate trend. The increase in yields from post-COVID central bank tightening is also apparent, with the 10-year real yield turning from negative to positive in 2021 amid nominal yields which rose higher than inflation. Currently, the 10-year real yield of 1.99%2 is below the all-time historical average of 2.44%, but that is still the highest level in more than five years, and it exceeds the averages of the past two decades.
Figure 1: The 10-Year Real Rate of Interest Has Been on a Downward Trajectory
Real Yields and the Economy
Fed policy, growth, inflation, supply, and demand all impact the US Treasury yield curve and ultimately the economic activity that occurs along various parts of the curve. We’ve seen through history that Fed policy typically controls the front end of the curve, while the tail is impacted by growth and inflation expectations. As nominal and real yields rise, economic activity that relies upon borrowing, lending, saving, and spending is impacted.
When real rates rise, economic activity is restricted, as it becomes more expensive to borrow, whereas saving is incentivized. With rates at current levels due to the Fed’s 525 bps of hikes, investors saving in money market funds (MMF) — which are essentially risk free — are earning a 5%–5.5% nominal yield. As inflation moderates, the real component of money market fund returns becomes more substantive. We’ve seen MMF assets under management roar higher for this reason (Figure 2).
Comparatively, one of the most common ways citizens borrow is through mortgages. The number of mortgage applications has declined precipitously amid higher real rates (Figure 3).
It seems as though higher interest rates are working as intended, slowing economic activity in order to cool inflation. Although we have seen progress on inflation, the Fed is steadfast in bringing levels closer to the desired target of 2%, and early 2024 inflation prints were running hotter than originally anticipated.
Analyzing the Equity Market Under Various Real Rate Backdrops
The economic consequences from high real interest rates can trickle down into corporate earnings, valuations, and eventually stock market prices. Higher rates impact how companies themselves spend and allocate funds. When it is expensive to finance new endeavors, there is less of an incentive to reinvest in growing businesses, which certainly puts a bearish cloud over future earnings prospects. Additionally, higher interest rates, which are used to discount future cash flows for valuation purposes, create multiples that look unattractive.
We analyzed how the market-cap-weighted US equity index has performed through a variety of real rate regimes. Over a wider history from 1982 to today, monthly performance of the S&P 500 exhibits a negative correlation of -0.66 to the 10-year real rate, a strong negative relationship. When using a shorter time horizon, from 2000 to today, the strength of this relationship weakens, although it is still negative at -0.27.3 Figure 4 illustrates the negative impact of real rates on prices.
Per Figure 4, when real rates are at the lower end of the spectrum, we have historically seen the healthiest levels of equity market return. However, the S&P 500 has shown to perform best under modestly positive levels of the 10-year real rate, between 0% and 1%. We currently4 sit in the 1%–2% bucket, with the 10-year real yield at 1.99%. Historically, at these levels, the S&P 500 has returned, on average, a flat return of -0.02%. By contrast, the S&P 500 return has been much stronger than that this year, with May returns upward of 4%. This strong performance can be attributed to a variety of factors, including:
- The strong rally we have seen among artificial intelligence–related names. However, even excluding the “Magnificent 7,” the S&P 500 has continued to defy the challenging real rate backdrop.
- Unwavering economic strength, healthy consumers, and resilient corporate earnings which may also be supporting equity market performance.
- Delayed/lagged effects of monetary policy which have not fully trickled through the system yet.
Diving further into specific areas of the equity market (Figure 5), the majority of sectors post their best return when real rates are positive but low, similar to the overall S&P 500 Index.
Figure 5: S&P 500 Average Monthly Return (by Sector) versus US 10-Year Real Rates
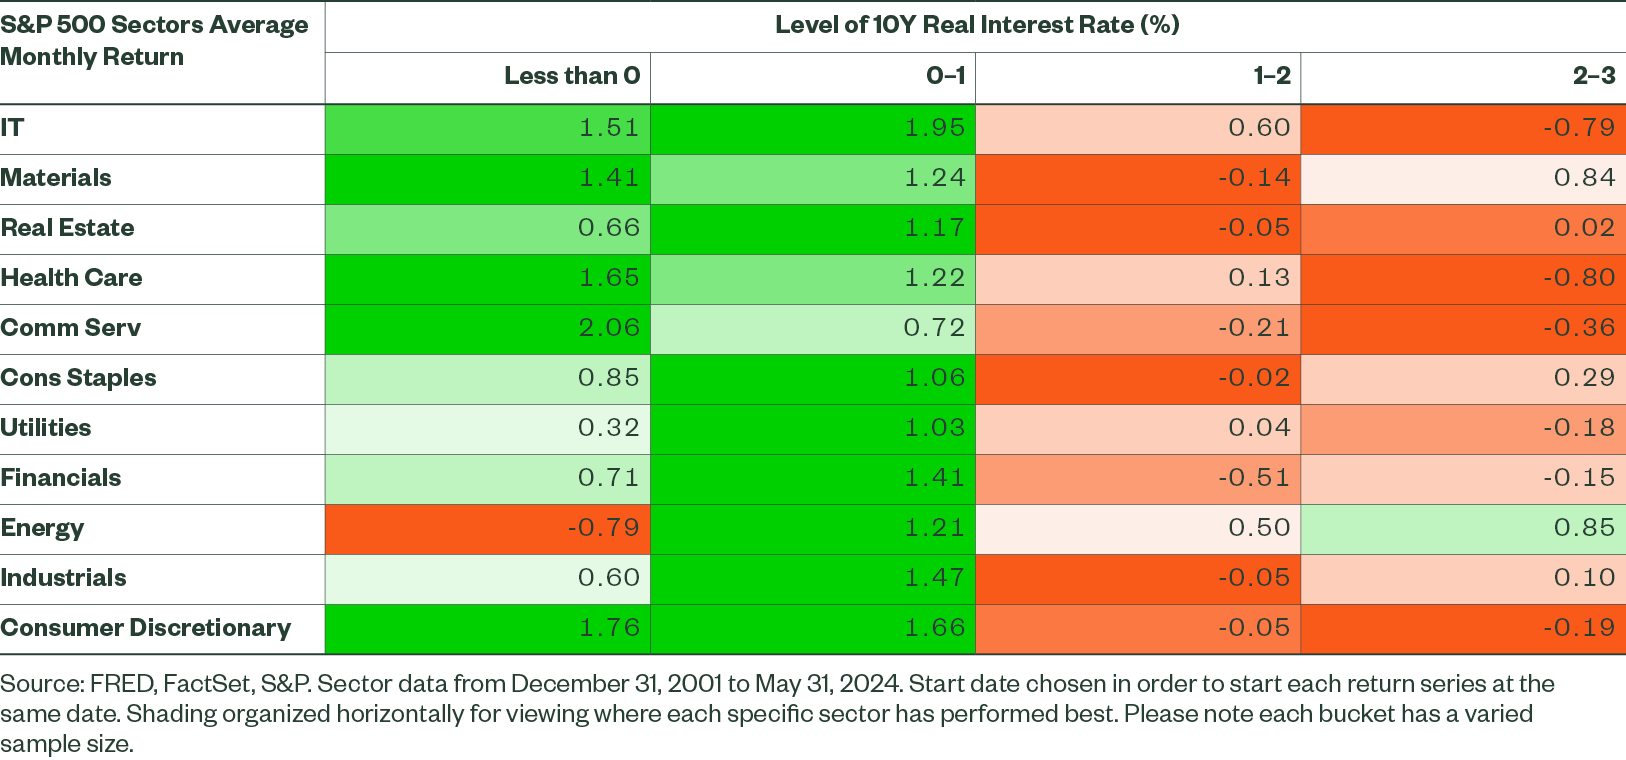
Specifically, seven of the 11 S&P 500 sectors have seen the highest monthly returns on average when the 10-year real interest rate is modestly positive, between 0% and 1%. Interestingly, the S&P 500 energy sector differs, in that its worst performance on average over the past approximately 22 years has been when real rates are negative. This is likely due to the cyclical and business cycle–reliant nature of energy stocks.
Within the large cap equity space, a move even higher in the real interest rate, or even prolonged stagnation at the current real rate, could further challenge the S&P 500 rally we have seen year to date.
Higher Rate Levels and Fixed Income Opportunity
On the fixed income side of the house, we favor bonds when economic growth is slowing and inflation is moderating — precisely the circumstance that is occurring today. As policy rates remain high even as inflation moderates, the level of real yields is supportive for those looking to invest in bonds. This is because investors can receive a real return that is comparable to equities, but with a much lower level of risk. Figure 6 shows how the equity risk premium — the return earned in excess of the nominal risk-free rate — has declined precipitously, meaning that equity investors are getting paid less per unit of risk. The current equity risk premium is at its lowest level in 23 years, exemplifying that bonds have become relatively more attractive.
That said, there are risks to the fixed income realm that come along with higher real rates. First, higher real rates introduce higher costs of borrowing for companies that need to issue new debt. If earnings do not keep up with higher costs of debt servicing, interest coverage ratios could deteriorate, increasing default risk. Additionally, as mentioned previously, higher real rates restrict the economy, which could prompt spread levels to widen should economic conditions deteriorate.
We continue to call for a soft landing (see 2024 Mid-Year Global Market Outlook). If the Fed is able to navigate a soft landing without causing harm to the economy, corporate credit assets could produce positive returns; nonetheless, we favor government bonds at this time, given the underlying recessionary risks. The benefit to owning US Treasuries is that whether a soft or a hard landing commences, they are poised to perform well. Our fixed income view is largely supported by the idea that the Fed has reached its peak policy rate. We’ve confirmed this through Fed speak, futures pricing, and our own economic forecasts. Additionally, we’ve seen the Bank of England and the Bank of Canada begin their rate cutting cycles, and we believe the Fed will follow this year.
Falling rates should be a natural tailwind to the fixed income asset class. However, a risk to our constructive view on fixed income is that we could experience another paradigm shift. In this scenario, the economy does not cool despite still-restrictive Fed policy, the Fed has to stay with tighter policy longer than market participants anticipate, and nominal rates rise even higher. If the terminal rate settles at a level that is materially higher than levels over the past 20 years, fixed income may not see as large a tailwind.
The Outlook for Real Rates
Nominal rates and inflation levels are the two measures that make up the real rate (Figure 7). In addition to the equation in Figure 7, we can point to the following connection between inflation and real rates: Intuitively, inflation is typically a driver of the fed funds rate, and the fed funds rate is typically correlated with nominal rates. Forecasts for inflation and nominal rates should provide a reasonable estimate of the level of real rates in the future.
Figure 7: Inflation Expectations Are a Key Input in Forecasting Real Rates
Future Nominal Rate – Future Inflation Rate = Future Real Rates
Inflation and Rate Forecasts
The 5y5y break-even inflation rate provides insight into what market participants expect for inflation on average over a five-year period, beginning five years from today. The 5y5y forward rate implies that the market expects the five-year nominal US Treasury yield to be 4.38% five years from now. This data point has risen from 4.12% at the beginning of 2024, reflecting the market’s revised expectations for rate cuts this year. Using the Fisher equation, subtracting expected 5y5y breakeven inflation of 2.29% from the expected nominal yield, the real rate five years from now is forecast at +2% — not materially different from its current state.
The Bottom Line
We believe that the Fed will begin cutting rates this year, but not until September, as 1Q24 macro data spawned a lack of certainty that inflation is steadily on a downward path. The future trajectory of inflation will determine where the level of long-term real yields ultimately lands, but we believe eventual rate cuts will bring the real yield closer to its more recent averages.
For equities, looser Fed policy, and real rates closer to the 0%–1% bucket, could mean a more supportive backdrop for equities and a stock price rally. However, history has shown that real rates between 1% and 3% have not been supportive for equities, apart from the energy sector (Figure 5).
On the fixed income side, falling rates will eventually benefit the asset class, and we advocate taking advantage of the higher yields before rate normalization occurs. If the Fed policy backdrop remains tight for longer than expected and causes harm, corporate credit spreads could widen from their current levels. For this reason, we favor government debt over credit.