Supply Chains Before and After the Pandemic
The COVID-19 pandemic had a significant impact on global supply chains, particularly after the first shock of the US/China trade war, serving as a catalyst for the reorientation of the factors of production in several countries and even across industry groups.
These initial shocks did originally have an impact on prices/inflation; however, it was not entirely clear what the dynamics might look like in the long term. This is a topic we will explore in this article at a more granular level.
The pandemic served as a reminder that there are significant bottlenecks and vulnerabilities in many supply chains that rely on a single source for all manufacturing or production processes.
The first phase led to a hyper-focus on diversification and the ability to withstand stresses to the supply chain. We seek to answer the following questions:
Did firms diversify their supplier base and invest in building more resilient supply chains that can withstand various stresses? Did firms on average make a deliberate shift towards nearshoring and regionalization? To mitigate risks associated with global supply chains, there have been several claims of noticeable trends towards nearshoring and regionalization. There have also been reports of individual companies who have restructured their supply chains to bring production closer to their local markets as a result diversifying away from distant suppliers. It has been difficult to obtain aggregate data from a bottom-up perspective for these claims, so in this paper, we attempt to take a first pass using our supply chain models within our stock selection apparatus.
In order to tackle the question on whether the global supply chain became more onshore or nearshored since the trade war and COVID, we first need to construct some key measures, outlined below.
We evaluate two static dates, one before the pandemic (January 2, 2018) and one after (December 1, 2023). For each company’s suppliers, we mainly look at two metrics:
- Proportion of onshore suppliers out of total. Onshore suppliers are defined as the supplier’s country being the same as the customer’s country.
- Average distance between suppliers and customers. Here we used country distance for simplicity. Specifically for each pair of customer and supplier, we computed the average physical distance (in kms) between their corresponding countries using data from CEPII (CEPII — GeoDist). It is important to note that depending on the country size, two companies from the same country may still have a non-zero distance.
Once we have constructed the company-level metrics, we can then aggregate them up at either the industry or region or country level. Having done this, we are now ready to examine some preliminary results and, given the sheer number of permutations, we will just highlight the notable ones.
Figure 1: Changes in the Distances by Industry Group (Jan 2018-Dec 2023)
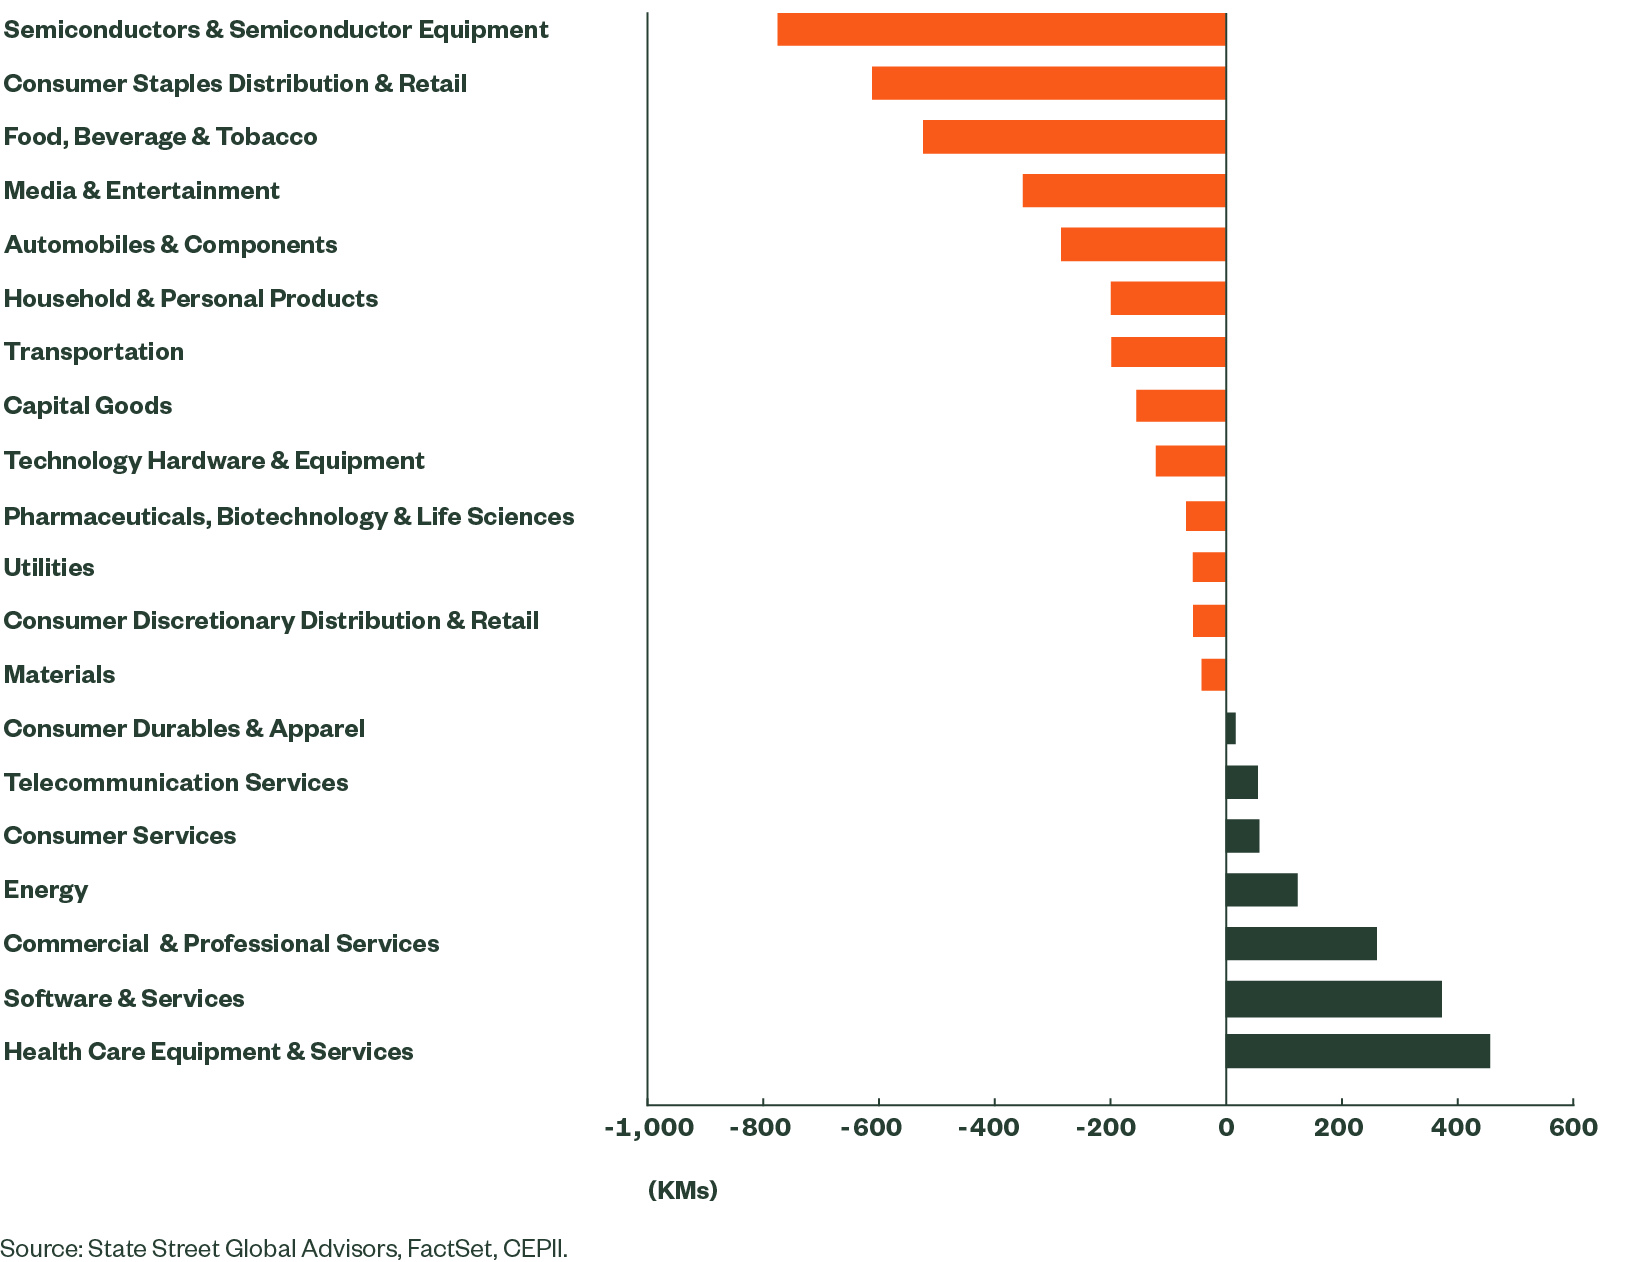
Semiconductors can be considered to be the modern equivalent of crude oil in that they power global economies, serving as the lifeblood for technological advancement and economic growth, particularly in an AI-driven world. It comes as no surprise, therefore, that the semiconductor industry brought their suppliers closer, by about 800 kms on average, over this 5-year period. The same was true for key consumer staples and retail for the domestic consumer, so as to combat inflationary pressures from markets that have the potential to inflict further price shocks, which then in turn could have ramifications for governments wrestling to contain inflation.
On the other side of the scale, less crucial goods such as software, professional services and health care equipment actually led to some specialization and the law of comparative advantage held true, perhaps with some continued outsourcing of goods that were less critical. The one exception to this rule of course is energy, which comes with natural endowment properties: it is hard to insource it or bring suppliers closer if the raw commodities don’t exist in the country!
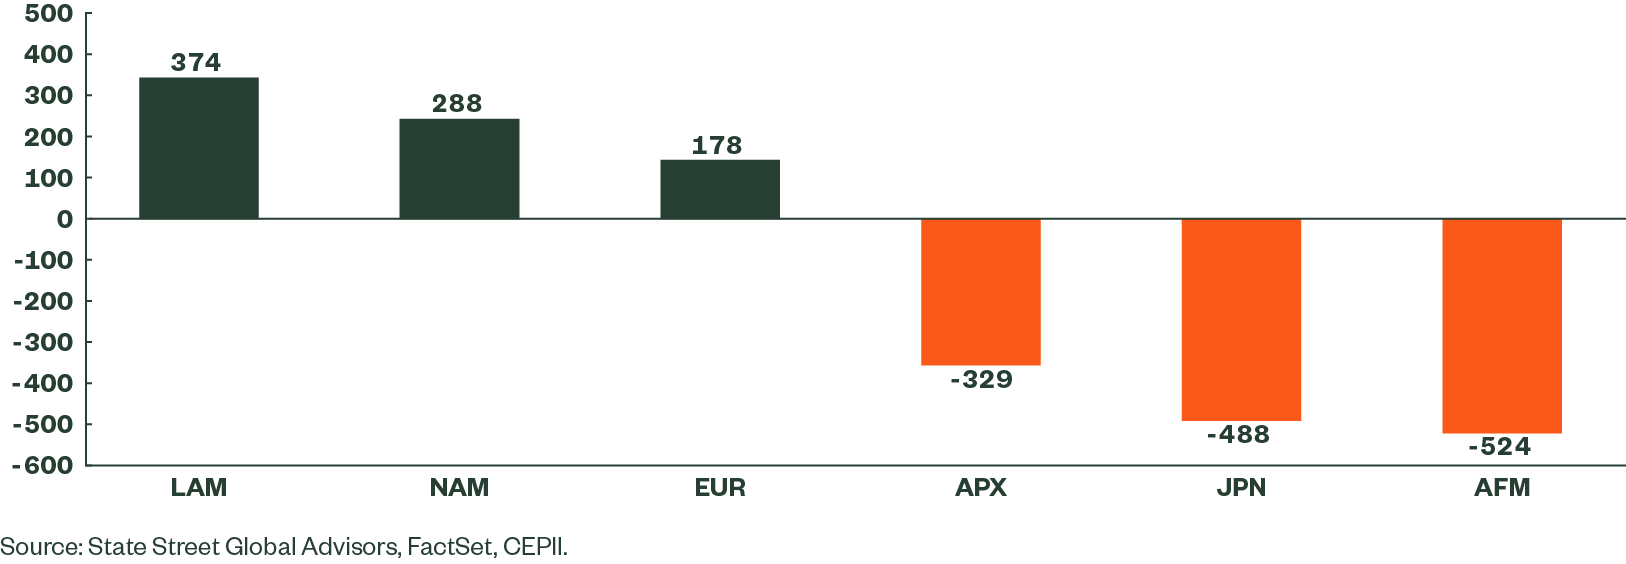
This first set of results begs the question, can we observe any key variations at the regional or country level? It appears on the surface that we look at the average distance between suppliers and customers. NAM (North America which is defined as the US and Canada), LAM (Latin America), and EUR (Europe) did not engage in much nearshoring, whereas JPN (Japan) and APX (Asia Pacific ex Japan) did quite a bit of nearshoring.
Figure 2: Changes in the Distances by Region (Jan 2018-Dec 2023)
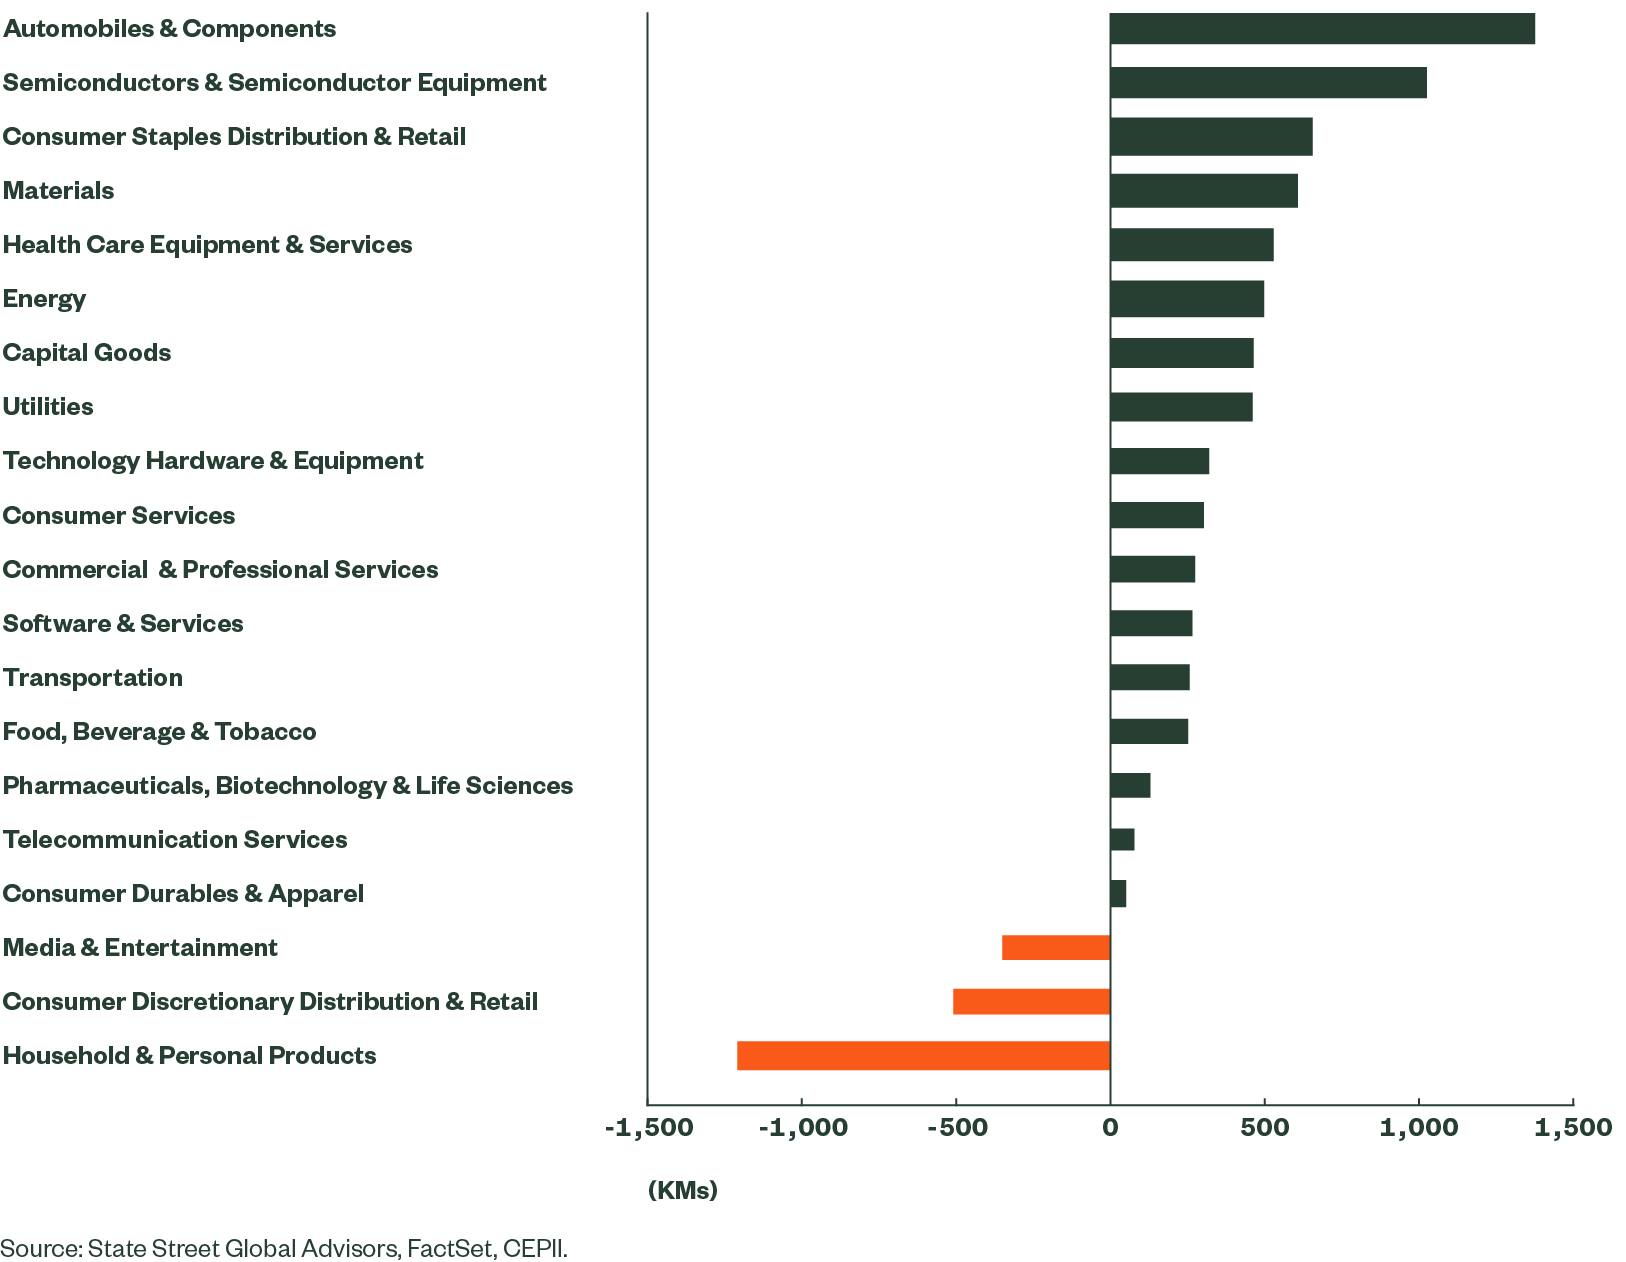
We take the US as an example to better understand what drove the change of supplier distribution. Below is the change in average supplier-customer distance for US companies by industry group. Contrary to popular belief, the majority of US companies shifted their production processes to suppliers that are farther away from the US. Interestingly, despite the heated debates surrounding the reshoring of the auto and semiconductor industries, they are among the top of the list of industries that have exhibited the most distance increases from suppliers.
Figure 3: Changes in the Suppliers Distances by US Industries (Jan 2018-Dec 2023)
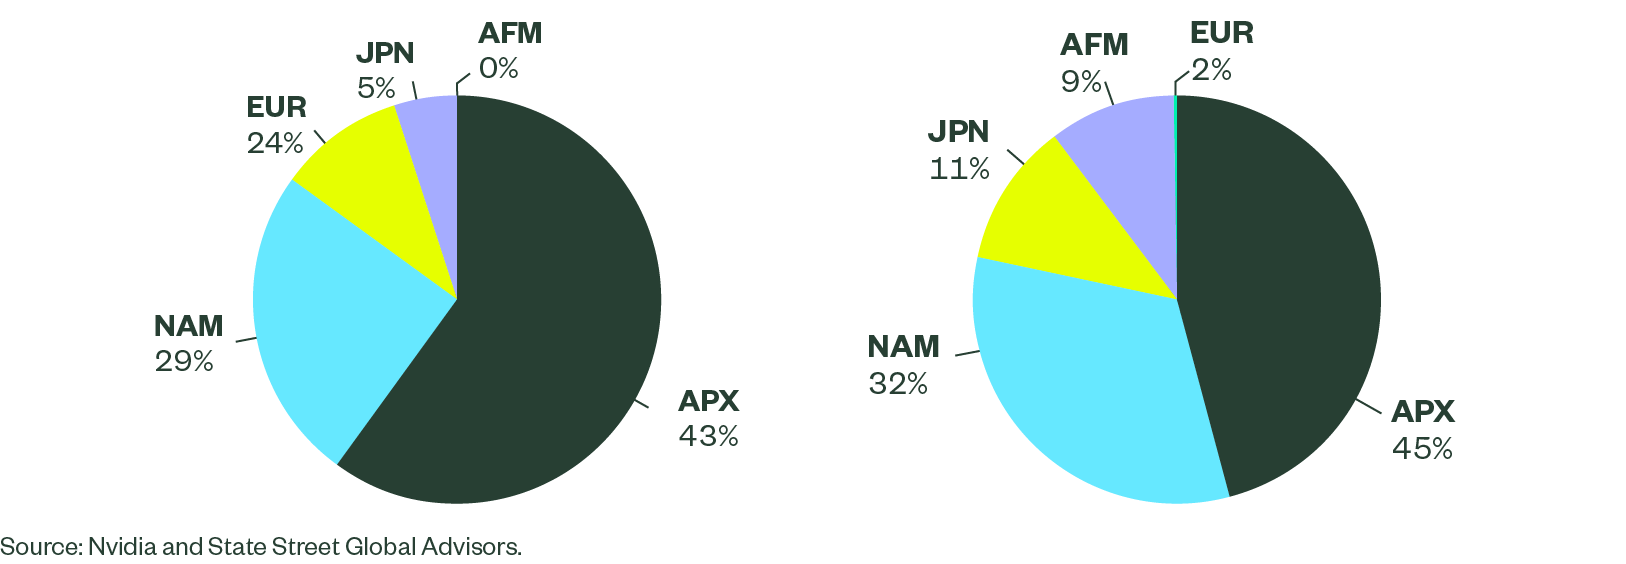
This can be further illustrated at the company level, using the example of Nvidia. In 2018, more than half of its suppliers were located in either North America or Europe, but this number dropped to only 34% in 2023, with the proportion of its European suppliers shrinking from 24% to 2%. About 57% of its suppliers came from Asia, including Japan, compared to 47% back in 2018.
Figure 4: Nvidia’s Suppliers by Region
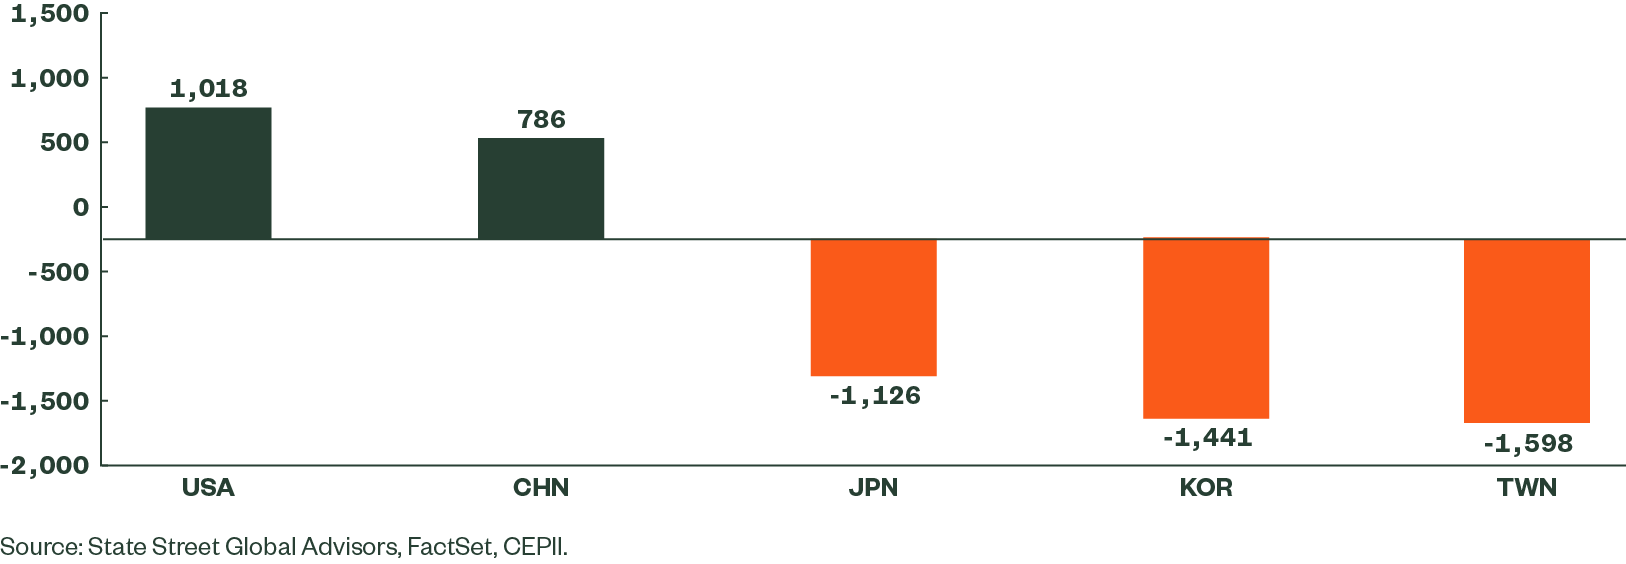
It turns out that much of the nearshoring in the semiconductor industry look place in Asia. Below is the change in average supplier and customer distances for the top 5 semiconductor manufacturing countries. It is clear Taiwan, Korea and Japan have taken the most initiatives into bringing their suppliers closer, while the U.S. and China have moved in the opposite direction.
Figure 5: Changes in Semiconductor Customer-Supplier Distance (Jan 2018–Dec 2023)
The world never remains static. Once one set of problems has been solved for, the world dishes out a new problem. Will the two wars now raging and the disruptions in Red Sea shipping unleash a new set of puzzles? In this ever-changing landscape, the countries that build the most adaptable and diverse supply chains will be best placed to react swiftly to changing dynamics, while providing resilience and new pathways to traditional supply chain routes in pandemics, war or other exogenous events.