Marketing Communication
Information Classification: General Access
Important Risk Information
For Investors in Austria The offering of SPDR ETFs by the Company has been notified to the Financial Markets Authority (FMA) in accordance with section 139 of the Austrian Investment Funds Act. Prospective investors may obtain the current sales Prospectus, the articles of incorporation, the KID as well as the latest annual and semi-annual report free of charge from State Street Global Advisors Europe Limited, Branch in Germany, Brienner Strasse 59, D-80333 Munich. T: +49 (0)89- 55878-400. F: +49 (0)89-55878-440.
For Investors in Finland The offering of funds by the Companies has been notified to the Financial Supervision Authority in accordance with Section 127 of the Act on Common Funds (29.1.1999/48) and by virtue of confirmation from the Financial Supervision Authority the Companies may publicly distribute their Shares in Finland. Certain information and documents that the Companies must publish in Ireland pursuant to applicable Irish law are translated into Finnish and are available for Finnish investors by contacting State Street Custodial Services (Ireland) Limited, 78 Sir John Rogerson’s Quay, Dublin 2, Ireland.
For Investors in France This document does not constitute an offer or request to purchase shares in the Company. Any subscription for shares shall be made in accordance with the terms and conditions specified in the complete Prospectus, the KID, the addenda as well as the Company Supplements. These documents are available from the Company centralizing correspondent: State Street Banque S.A., Coeur Défense — Tour A — La Défense 4 33e étage 100, Esplanade du Général de Gaulle 92 931 Paris La Défense cedex France or on the French part of the site ssga.com. The Company is an undertaking for collective investment in transferable securities (UCITS) governed by Irish law and accredited by the Central Bank of Ireland as a UCITS in accordance with European Regulations. European Directive no. 2014/91/EU dated 23 July 2014 on UCITS, as amended, established common rules pursuant to the cross-border marketing of UCITS with which they duly comply. This common base does not exclude differentiated implementation. This is why a European UCITS can be sold in France even though its activity does not comply with rules identical to those governing the approval of this type of product in France. The offering of these compartments has been notified to the Autorité des Marchés Financiers (AMF) in accordance with article L214-2-2 of the French Monetary and Financial Code.
For Investors in Germany The offering of SPDR ETFs by the Companies has been notified to the Bundesanstalt für Finanzdienstleistungsaufsicht (BaFin) in accordance with section 312 of the German Investment Act. Prospective investors may obtain the current sales Prospectuses, the articles of incorporation, the KIDs as well as the latest annual and semi-annual report free of charge from State Street Global Advisors Europe Limited, Branch in Germany, Brienner Strasse 59, D-80333 Munich. T: +49 (0)89- 55878-400. F: +49 (0)89-55878-440.
Ireland Entity State Street Global Advisors Europe Limited is regulated by the Central Bank of Ireland. Registered office address 78 Sir John Rogerson’s Quay, Dublin 2. Registered Number: 49934. T: +353 (0)1 776 3000. F: +353 (0)1 776 3300.
Israel No action has been taken or will be taken in Israel that would permit a public offering of the Securities or distribution of this sales brochure to the public in Israel. This sales brochure has not been approved by the Israel Securities Authority (the ‘ISA’).
Accordingly, the Securities shall only be sold in Israel to an investor of the type listed in the First Schedule to the Israeli Securities Law, 1978, which has confirmed in writing that it falls within one of the categories listed therein (accompanied by external confirmation where this is required under ISA guidelines), that it is aware of the implications of being considered such an investor and consents thereto, and further that the Securities are being purchased for its own account and not for the purpose of re-sale or distribution.
This sales brochure may not be reproduced or used for any other purpose, nor be furnished to any other person other than those to whom copies have been sent.
Nothing in this sales brochure should be considered investment advice or investment marketing as defined in the Regulation of Investment Advice, Investment Marketing and Portfolio Management Law, 1995 (“the Investment Advice Law”). Investors are encouraged to seek competent investment advice from a locally licenced investment advisor prior to making any investment. State Street is not licenced under the Investment Advice Law, nor does it carry the insurance as required of a licencee thereunder.
This sales brochure does not constitute an offer to sell or solicitation of an offer to buy any securities other than the Securities offered hereby, nor does it constitute an offer to sell to or solicitation of an offer to buy from any person or persons in any state or other jurisdiction in which such offer or solicitation would be unlawful, or in which the person making such offer or solicitation is not qualified to do so, or to a person or persons to whom it is unlawful to make such offer or solicitation.
Italy Entity State Street Global Advisors Europe Limited, Italy Branch (“State Street Global Advisors Italy”) is a branch of State Street Global Advisors Europe Limited, registered in Ireland with company number 49934, authorised and regulated by the Central Bank of Ireland, and whose registered office is at 78 Sir John Rogerson’s Quay, Dublin 2. State Street Global Advisors Italy is registered in Italy with company number 11871450968 - REA: 2628603 and VAT number 11871450968, and its office is located at Via Ferrante Aporti, 10 - 20125 Milan, Italy. T: +39 02 32066 100. F: +39 02 32066 155.
For Investors in Luxembourg The Companies have been notified to the Commission de Surveillance du Secteur Financier in Luxembourg in order to market their shares for sale to the public in Luxembourg and the Companies are notified Undertakings in Collective Investment for Transferable Securities (UCITS).
For Investors in the Netherlands This communication is directed at qualified investors within the meaning of Section 2:72 of the Dutch Financial Markets Supervision Act (Wet op het financieel toezicht) as amended. The products and services to which this communication relates are only available to such persons and persons of any other description should not rely on this communication. Distribution of this document does not trigger a licence requirement for the Companies or SSGA in the Netherlands and consequently no prudential and conduct of business supervision will be exercised over the Companies or SSGA by the Dutch Central Bank (De Nederlandsche Bank N.V.) and the Dutch Authority for the Financial Markets (Stichting Autoriteit Financiële Markten). The Companies have completed their notification to the Authority Financial Markets in the Netherlands in order to market their shares for sale to the public in the Netherlands and the Companies are, accordingly, investment institutions (beleggingsinstellingen) according to Section 2:72 Dutch Financial Markets Supervision Act of Investment Institutions.
For Investors in Norway The offering of SPDR ETFs by the Companies has been notified to the Financial Supervisory Authority of Norway (Finanstilsynet) in accordance with applicable Norwegian Securities Funds legislation. By virtue of a confirmation letter from the Financial Supervisory Authority dated 28 March 2013 (16 October 2013 for umbrella II) the Companies may market and sell their shares in Norway.
For Investors in Spain State Street Global Advisors SPDR ETFs Europe I and II plc have been authorised for public distribution in Spain and are registered with the Spanish Securities Market Commission (Comisión Nacional del Mercado de Valores) under no.1244 and no.1242. Before investing, investors may obtain a copy of the Prospectus and Key Information Documents, the Marketing Memoranda, the fund rules or instruments of incorporation as well as the annual and semi-annual reports of State Street Global Advisors SPDR ETFs Europe I and II plc from Cecabank, S.A. Alcalá 27, 28014 Madrid (Spain) who is the Spanish Representative, Paying Agent and distributor in Spain or at spdrs.com. The authorised Spanish distributor of State Street Global Advisors SPDR ETFs is available on the website of the Securities Market Commission (Comisión Nacional del Mercado de Valores).
For Investors in Switzerland The collective investment schemes referred to herein are collective investment schemes under Irish law. Prospective investors may obtain the current sales prospectus, the articles of incorporation, the KID as well as the latest annual and semi-annual reports free of charge from the Swiss Representative and Paying Agent, State Street Bank International GmbH, Munich, Zurich Branch, Beethovenstr. 19, 8027 Zurich, as well as from the main distributor in Switzerland, State Street Global Advisors AG, Beethovenstrasse 19, 8027 Zurich. Before investing please read the prospectus and the KID, copies of which can be obtained from the Swiss representative, or at www.ssga.com.
Issuer Entity
For Investors in the UK This document has been issued by State Street Global Advisors Limited (“SSGAL”). Authorized and regulated by the Financial Conduct Authority, Registered No.2509928. VAT No. 5776591 81. Registered office: 20 Churchill Place, Canary Wharf, London, E14 5HJ. T: 020 3395 6000. F: 020 3395 6350. Web: ssga.com.
This document has been issued by State Street Global Advisors Europe Limited (“SSGAEL”), regulated by the Central Bank of Ireland. Registered office address 78 Sir John Rogerson’s Quay, Dublin 2. Registered number 49934. T: +353 (0)1 776 3000. F: +353 (0)1 776 3300.
ETFs trade like stocks, are subject to investment risk and will fluctuate in market value. The investment return and principal value of an investment will fluctuate in value, so that when shares are sold or redeemed, they may be worth more or less than when they were purchased. Although shares may be bought or sold on an exchange through any brokerage account, shares are not individually redeemable from the fund. Investors may acquire shares and tender them for redemption through the fund in large aggregations known as “creation units.” Please see the fund’s prospectus for more details.
SPDR ETFs is the exchange traded funds (“ETF”) platform of State Street Global Advisors and is comprised of funds that have been authorised by Central Bank of Ireland as open-ended UCITS investment companies.
State Street Global Advisors SPDR ETFs Europe I & SPDR ETFs Europe II plc issue SPDR ETFs, and is an open-ended investment company with variable capital having segregated liability between its sub-funds. The Company is organised as an Undertaking for Collective Investments in Transferable Securities (UCITS) under the laws of Ireland and authorised as a UCITS by the Central Bank of Ireland.
Investing involves risk including the risk of loss of principal.
Diversification does not ensure a profit or guarantee against loss.
Past performance is not a reliable indicator of future performance.
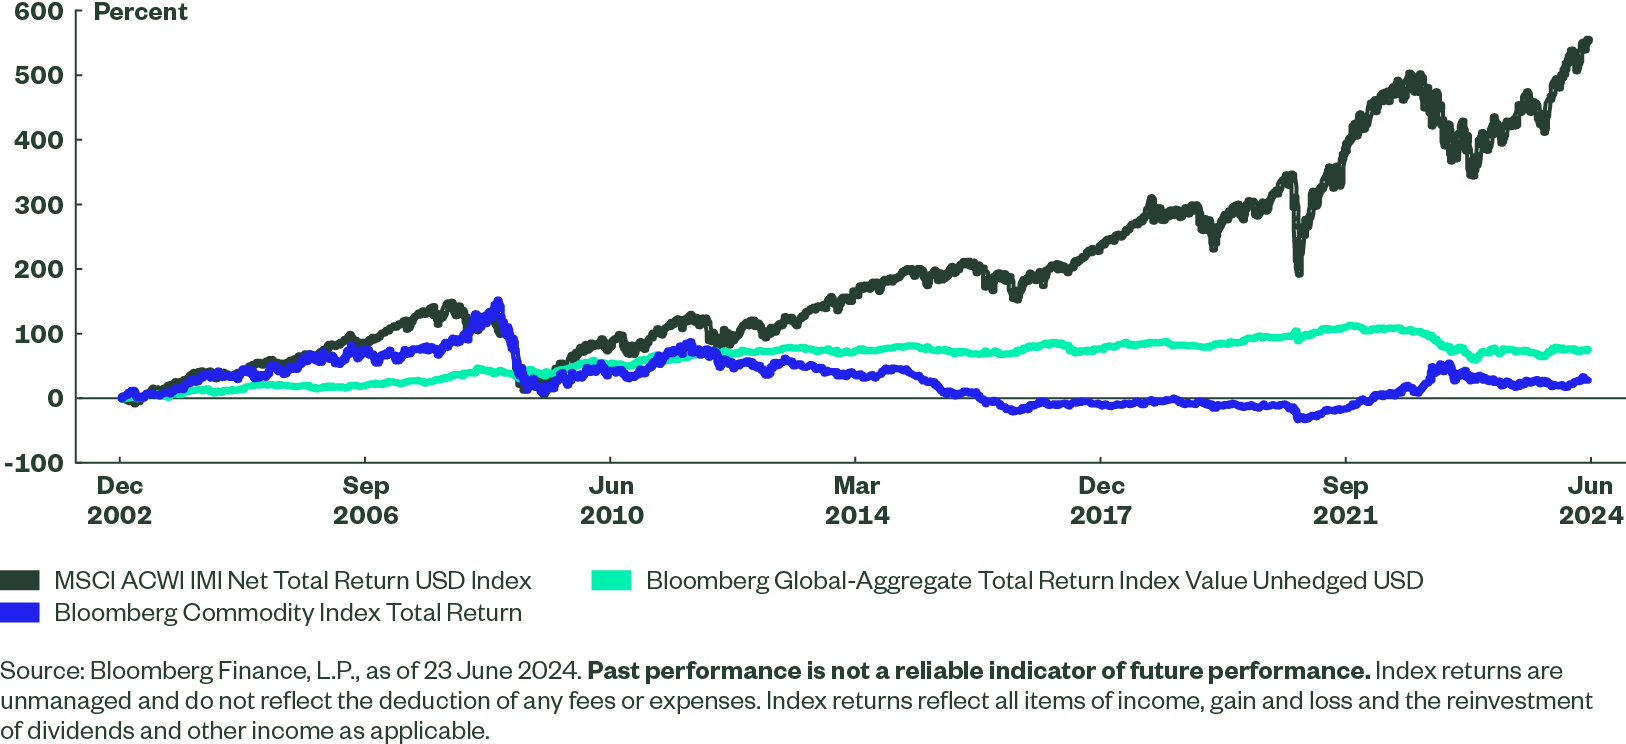
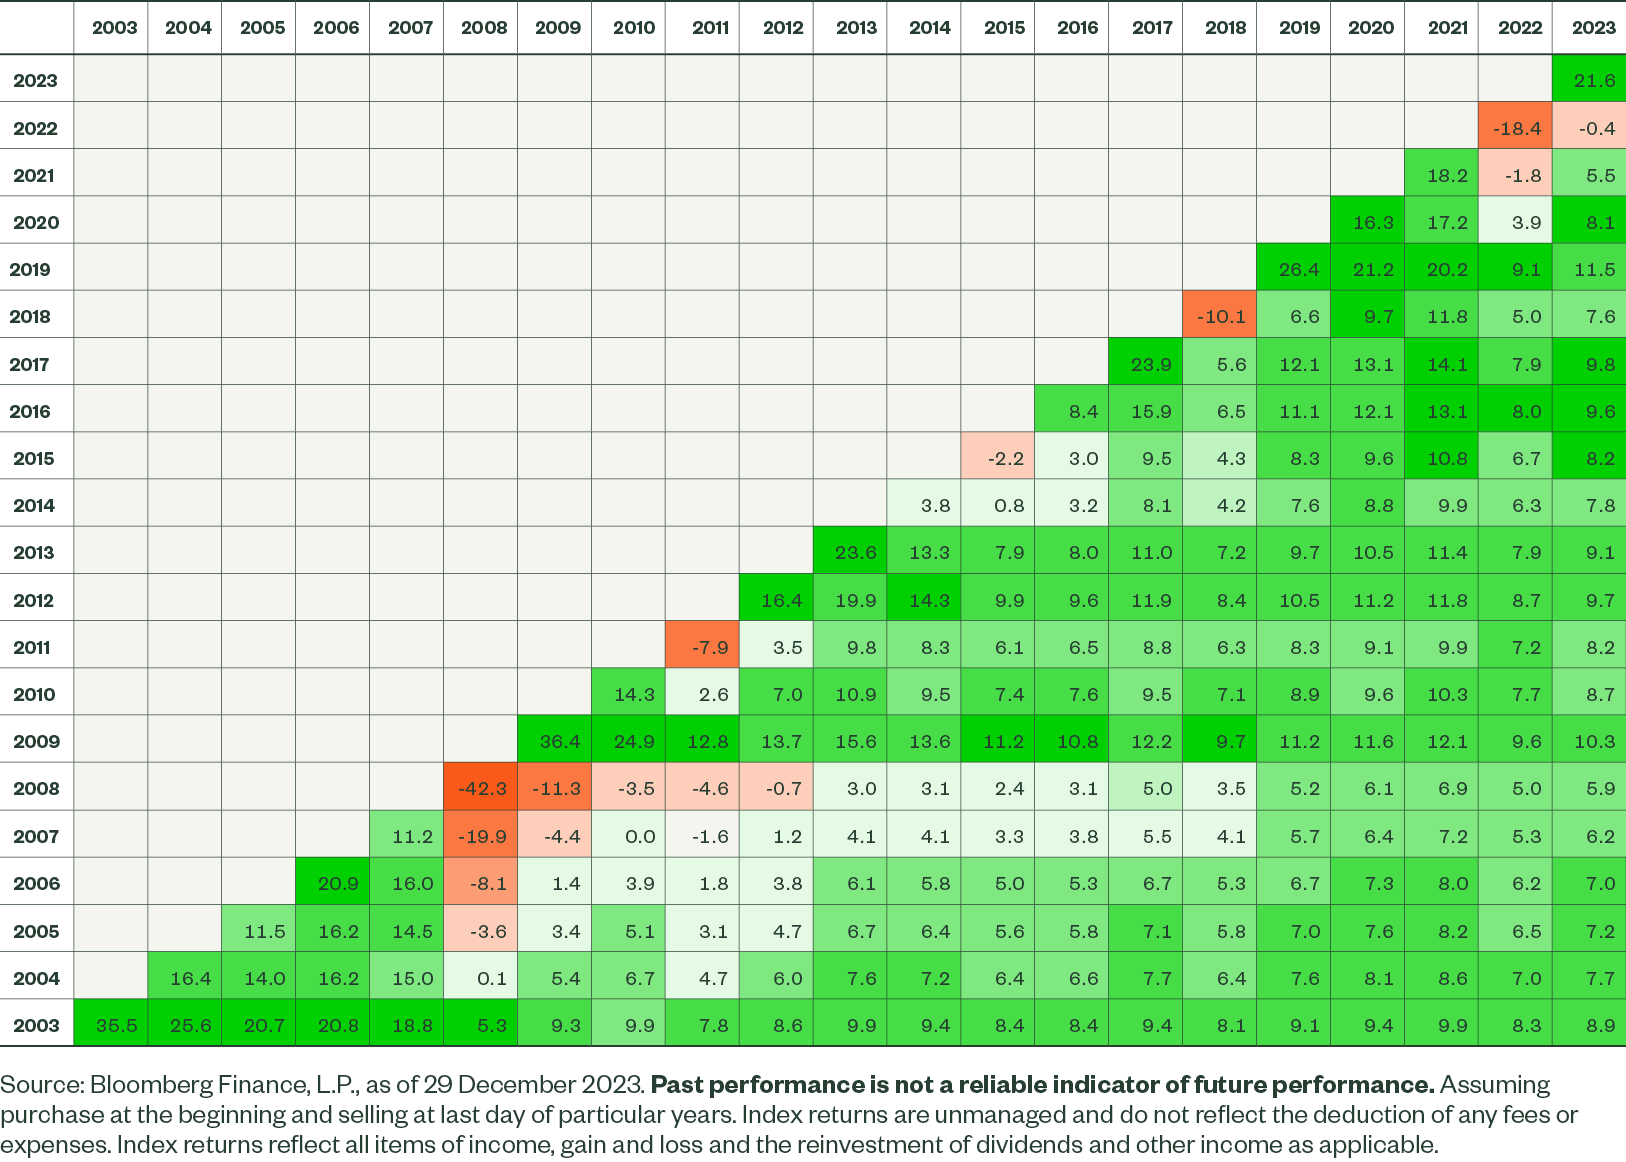
Index returns are unmanaged and do not reflect the deduction of any fees or expenses. Index returns reflect all items of income, gain and loss and the reinvestment of dividends and other income as applicable.
All the index performance results referred to are provided exclusively for comparison purposes only. It should not be assumed that they represent the performance of any particular investment.
The trademarks and service marks referenced herein are the property of their respective owners. Third party data providers make no warranties or representations of any kind relating to the accuracy, completeness or timeliness of the data and have no liability for damages of any kind relating to the use of such data.
The information provided does not constitute investment advice as such term is defined under the Markets in Financial Instruments Directive (2014/65/EU) or applicable Swiss regulation and it should not be relied on as such. It should not be considered a solicitation to buy or an offer to sell any investment. It does not take into account any investor’s or potential investor’s particular investment objectives, strategies, tax status, risk appetite or investment horizon. If you require investment advice you should consult your tax and financial or other professional advisor.
All information is from SSGA unless otherwise noted and has been obtained from sources believed to be reliable, but its accuracy is not guaranteed. There is no representation or warranty as to the current accuracy, reliability or completeness of, nor liability for, decisions based on such information and it should not be relied on as such.
This communication is directed at professional clients (this includes eligible counterparties as defined by the appropriate EU regulator) who are deemed both knowledgeable and experienced in matters relating to investments. The products and services to which this communication relates are only available to such persons and persons of any other description (including retail clients) should not rely on this communication.
The whole or any part of this work may not be reproduced, copied or transmitted or any of its contents disclosed to third parties without SSGA’s express written consent.
Equity securities may fluctuate in value in response to the activities of individual companies and general market and economic conditions.
Investments in emerging or developing markets may be more volatile and less liquid than investing in developed markets and may involve exposure to economic structures that are generally less diverse and mature and to political systems which have less stability than those of more developed countries.
Investing in foreign domiciled securities may involve risk of capital loss from unfavourable fluctuation in currency values, withholding taxes, from differences in generally accepted accounting principles or from economic or political instability in other nations.
The views expressed in this material are the views of SPDR EMEA Strategy and Research through 26 June 2024 and are subject to change based on market and other conditions. This document contains certain statements that may be deemed forward-looking statements. Please note that any such statements are not guarantees of any future performance and actual results or developments may differ materially from those projected.
The S&P 500® Index is a product of S&P Dow Jones Indices LLC or its affiliates (“S&P DJI”) and have been licensed for use by State Street Global Advisors. S&P®, SPDR®, S&P 500®, US 500 and the 500 are trademarks of Standard & Poor’s Financial Services LLC (“S&P”); Dow Jones® is a registered trademark of Dow Jones Trademark Holdings LLC (“Dow Jones”) and has been licensed for use by S&P Dow Jones Indices; and these trademarks have been licensed for use by S&P DJI and sublicensed for certain purposes by State Street Global Advisors. The fund is not sponsored, endorsed, sold or promoted by S&P DJI, Dow Jones, S&P, their respective affiliates, and none of such parties make any representation regarding the advisability of investing in such product(s) nor do they have any liability for any errors, omissions, or interruptions of these indices.
Please refer to the Fund’s latest Key Information Document (KID)/Key Investor Information Document (KIID) and Prospectus before making any final investment decision. The latest English version of the prospectus and the KID/KIID can be found at ssga.com. A summary of investor rights can be found here: https://www.ssga.com/library-content/products/fund-docs/summary-of-investor-rights/ssga-spdr-investors-rights-summary.pdf.
Note that the Management Company may decide to terminate the arrangements made for marketing and proceed with de-notification in compliance with Article 93a of Directive 2009/65/EC.
The information contained in this communication is not a research recommendation or ‘investment research’ and is classified as a ‘Marketing Communication’ in accordance with the Markets in Financial Instruments Directive (2014/65/EU) or applicable Swiss regulation. This means that this marketing communication (a) has not been prepared in accordance with legal requirements designed to promote the independence of investment research (b) is not subject to any prohibition on dealing ahead of the dissemination of investment research.
2015149.281.2.EMEA.INST
Exp. Date: 30 June 2025
© 2024 State Street Corporation – All Rights Reserved.


