Title TBC
- Bullet point 1
- Bullet point 2
Theme of the week
Navigating Uncertainty Like an Aristocrat!
If you only browsed through recent headlines, you may believe that global markets are awash with good news. Prospects for global trade received a positive boost following a meeting between presidents Trump and Xi at the G20, which is helping the S&P 500 Index approach 3000—a historic nominal milestone. Global growth, while moderating, is still in expansion, and unemployment is at generational lows across developed markets.
Given this positivity, investors are left wondering why business sentiment continues to deteriorate and the US yield curve is pricing a 100% chance of a Fed rate cut in July. What signals should investors be following?
The answer is not obvious. In the US, business sentiment continues to follow Manufacturing PMIs lower, as the IHS Markit US Manufacturing PMI fell to 50.1 in June, suggesting the weakest expansion of the manufacturing sector in nearly a decade.1 This is no doubt due, in part, to the ongoing negative trade escalation between the US and China. Non-manufacturing (or services) have also seen a decline, but at a lower magnitude than manufacturing. With fundamentals in the US deteriorating, but the market continuing to push through new all-time highs, investors face a real challenge in determining how aggressively to invest.
How does a Dividend Aristocrats strategy help capture upside, with potential downside protection?
Investors seeking to remain long equity markets, but fearful of uncertainty, can look at a quality income, dividend growth strategy. The Dividend Aristocrats strategy picks companies that grow their regular cash dividends from a diversified base of sectors. As displayed in Figure 1 below, dividend growth strategies have outperformed high dividend strategies during the past year, and thus offer a way to help investors navigate potential uncertainty.
Figure 1: MSCI USA Factor Index vs. MSCI USA Index (1 Year)

Source: Bloomberg Finance, L.P., as of 31 May 2019. Past performance is not a guarantee of future results. MSCI USA Minimum Volatility Index, MSCI USA Enhanced Value Index, MSCI USA Quality Index, MSCI USA Equal Weighted Index, MSCI USA High Dividend Yield Index, MSCI USA Momentum Index, S&P High Yield Dividend Aristocrats and MSCI USA Factor Mix A-series Index were used to represent Min. Vol., Value, Quality, Size, Dividend, Momentum, Dividend Grower and Multifactor strategies. Index were used above compared to the MSCI USA Index. Index returns are unmanaged and do not reflect the deduction of any fees or expenses.
Related funds
How to play this theme:
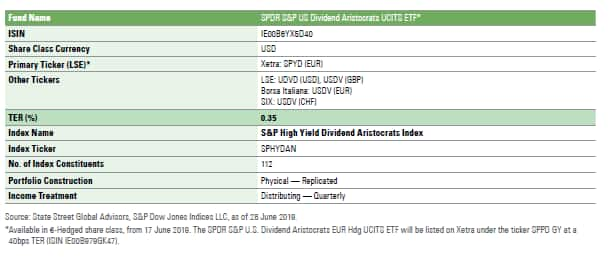
- SPDR S&P US Dividend Aristocrats UCITS ETF
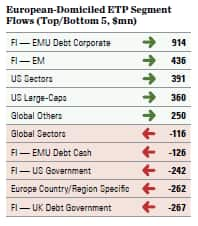
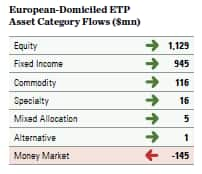
Sources: Bloomberg Finance L.P., for the period 27 June–4 July 2019. This information should notbe considered a recommendation to invest in a particular sector or to buy or sell any security shown.It is not known whether the sectors or securities shown will be profitable in the future.
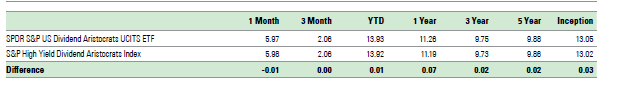
Source: State Street Global Advisors, as at 31 May 2019. Fund Inception was 14 October 2011. Performance quoted represents past performance, which is no guarantee of future results. Investment return and principal value will fluctuate, so you may have a gain or loss when shares are sold. Current performance may be higher or lower than that quoted. All results are historical and assume the reinvestment of dividends and capital gains. Visit spdrs.com for most recent monthend performance. The calculation method for value added returns may show rounding differences. Index returns are unmanaged and do not reflect the deduction of any fees or expenses. Some of the products are not available to investors in certain jurisdictions. Please contact your relationship manager in regards to availability.
Contact us for more information
To receive regular insights
Visit our Investor Resources centre to learn more