Small and Mid Caps: A Case for Strategic US Equity Diversification
- Small and mid caps are a vital core allocation, representing 15% of the US market. They can also help reduce concentration risk when incorporated into a portfolio.
- Small and mid caps trade at lower valuations (e.g., price-to-earnings) compared to the S&P 500.
- With interest rates peaking, small and mid caps may offer potential for higher returns.
The concentration of stocks within US large-cap equities, as represented by the S&P 500® Index, remains notably high as the top ten holdings comprise nearly 35% of the index.1 This concentration is largely driven by the exceptional performance of technology-oriented mega-cap stocks often referred to as the Magnificent 7, which includes Alphabet, Amazon, Apple, Meta, Microsoft, Nvidia, and Tesla. The increasing concentration within US large caps presents significant risk: a downturn in any of these leading stocks could result in substantial drawdowns for investors due to insufficient diversification. The continued rise of these stocks has led to premium valuations, resulting in higher investment costs.
Investors are actively seeking alternative ways to gain exposure through more affordable segments of the US market. Strategies such as blending large caps with a proportion of mid and small caps are being explored to mitigate the rising concentration within large-cap equities. Here, we’ll review the results of adding varying amounts of blended small- and mid-cap allocations into a large-cap portfolio.
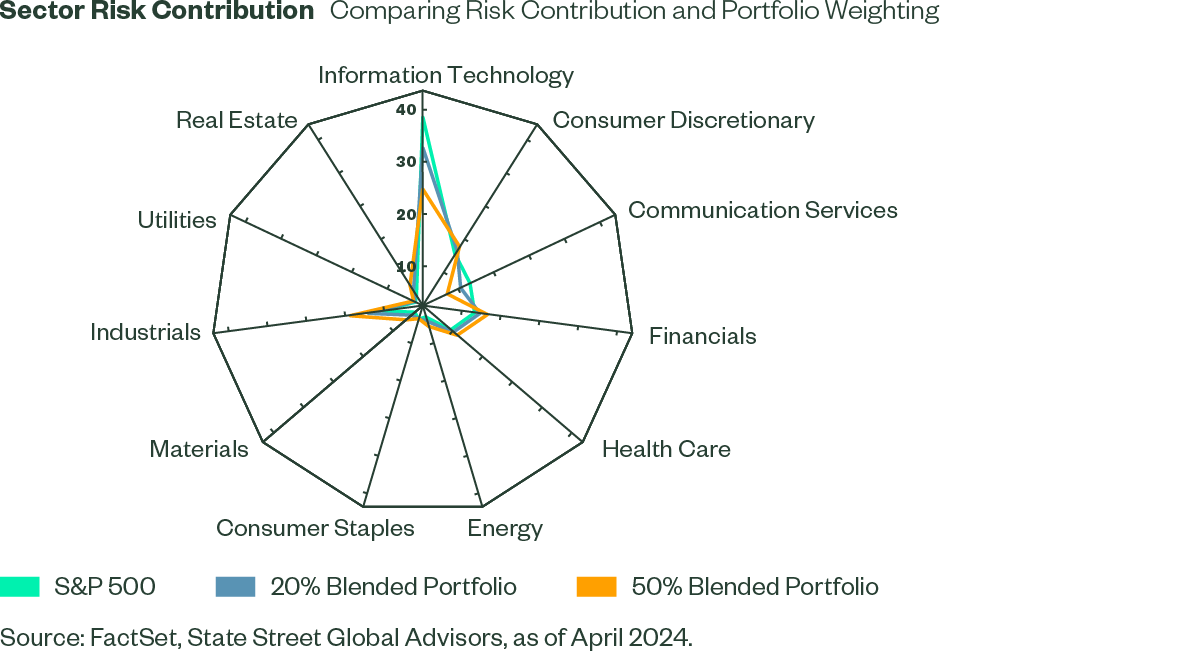
Sector Risk Concentration
The Information Technology (IT) sector dominates the S&P 500, representing 29% of the index. This dominance also leads to an outsized risk contribution, as the sector represents 38% of the risk. Sector concentration has been increasing over time, exposing portfolios to higher sector concentration risks. Given their more balanced sector exposures, small and mid caps provide a potentially effective response for managing this risk. By blending small and mid caps, investors can achieve a more balanced sector risk contribution. For instance, a 50% blended portfolio – which involves blending 50% large cap and 50% mid and small caps - shows a more balanced sector risk map, with IT contributing 24% compared to the original 38%; Financials and Industrials can also play a significant role in helping to balance risk (see Figure 1).
Figure 1
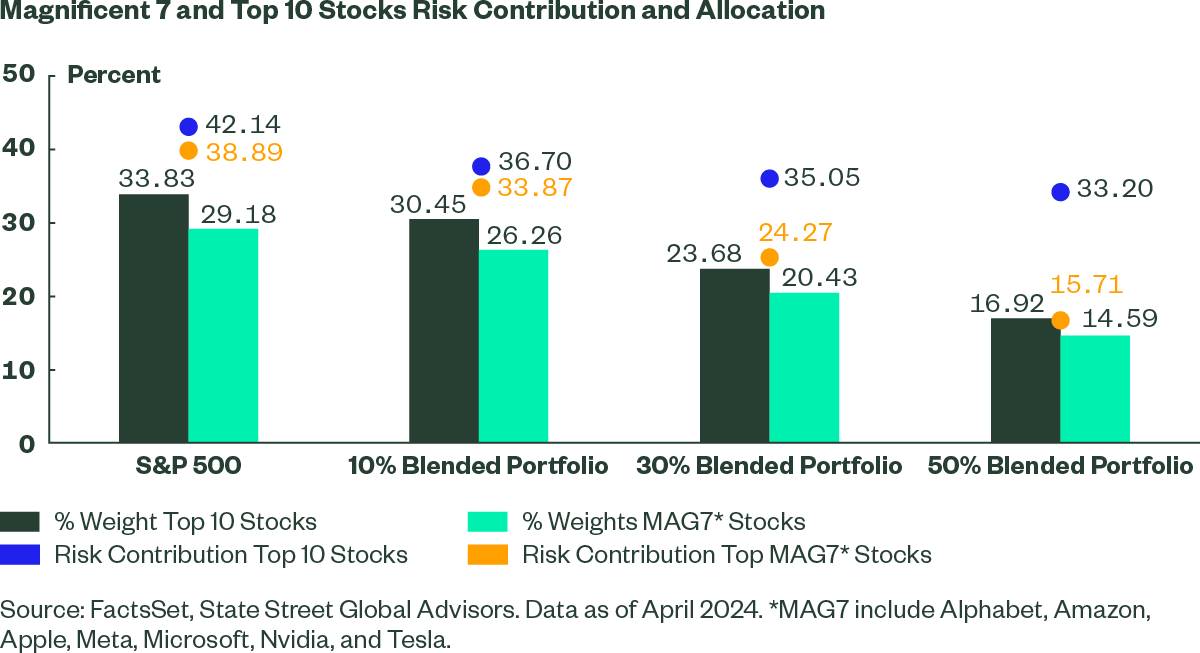
Mitigating Magnificent 7 Concentration Risk
Blending small and mid caps within a US allocation also significantly reduces concentration risk from the Magnificent 7. A portfolio with 50% mid and small caps and 50% large cap exposure reduces the Magnificent 7’s risk contribution by 60%, from 38.89% to 15.71%, thus enhancing diversification within the portfolio. Our analysis indicates that even a 10% allocation to mid and small caps offers significant portfolio diversification benefits (see Figure 2).
Figure 2
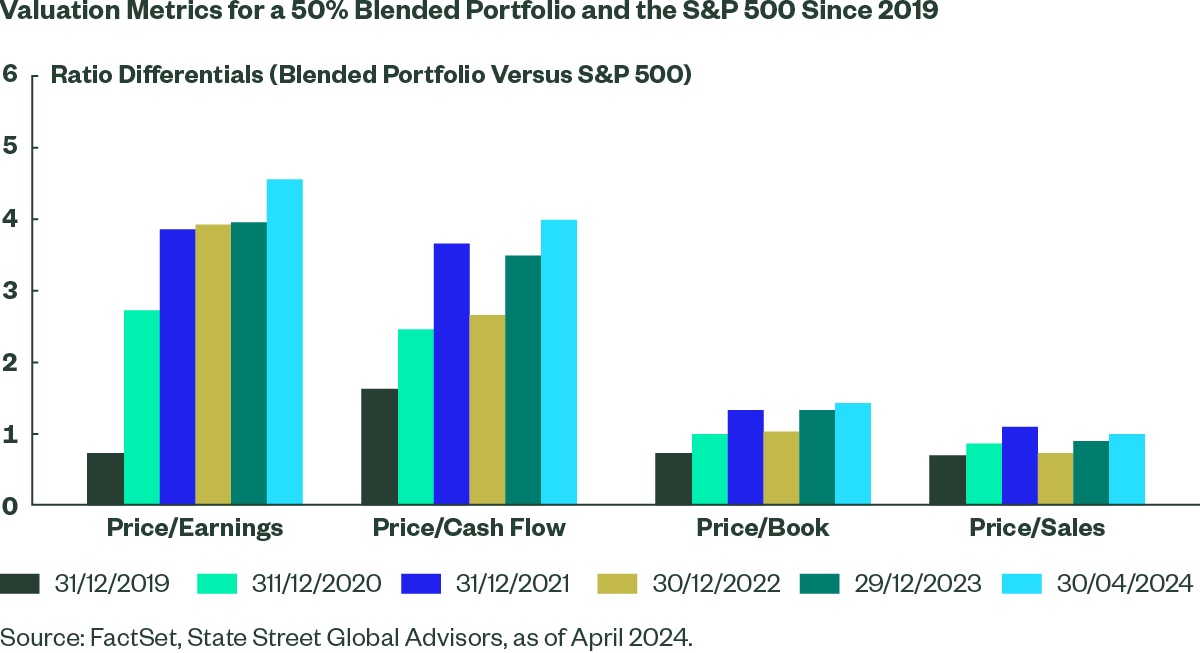
Impact on Valuation
Integrating large caps with mid and small caps to gain broader US equity market exposure may reduce overall valuation. For example, a portfolio blended with 50% mid and small caps and 50% large caps exhibited a price-to-earnings (P/E) ratio of 20.5x, compared to 25x for the S&P 500, representing an improvement of approximately 20% (see Figure 3). This lower valuation for the blended portfolio extends beyond the P/E ratio to other valuation metrics, with the most significant differential observed in earnings-based measures. This disparity suggests that an earnings disappointment may lead to a more pronounced adjustment in the performance of the S&P 500 compared to the blended portfolio, given the substantial P/E differential.
Figure 3
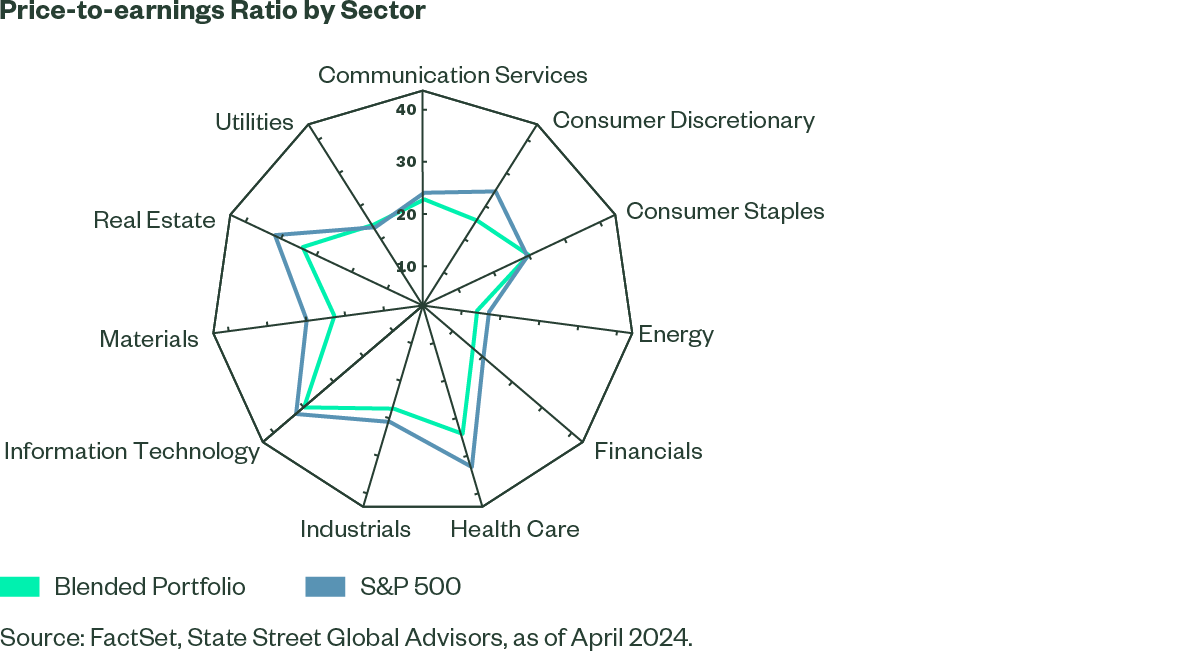
Due to the concentration of Technology companies within the S&P 500, one might attribute the high valuation differential between the blended portfolio and the S&P 500 solely to this sector. However, this is not entirely accurate. Both the Health Care and Consumer Discretionary sectors, which are among the top four sectors in the S&P 500, exhibit significantly higher valuation differentials, with ratios of 28.1x versus 35x and 20.1x versus 27.3x, respectively (see Figure 4).
Figure 4
Finding the Right US Blend
Finally, it is important to bear in mind the widely accepted and time-tested adage is “never bet against US exceptionalism.” With interest rates peaking and the US economy primed for a soft landing, small and mid caps offer potential for higher returns. Our analysis shows that since 1995, mid and small caps have provided higher upside participation compared to the S&P 500. Historically, a portfolio with a 50% allocation to mid and small caps shows negligible deterioration in returns and a very similar risk profile. Over the past 15 years, a 50% blended portfolio exhibited a maximum drawdown of 24.83% versus 24.14% for the S&P 500.2 Investors can choose the optimal blend of mid and small caps based on their risk profiles.