Broadening Out From Tech
Hedging Risk with a Sector Barbell
Information Technology is a standout sector in terms of returns and prospects. The risk for investors is that given the remarkable performance, a correction is possible. How can investors look to reduce risk and yet still access the growth themes of the sector? We consider the benefits of keeping your tech holding and adding a defensive sector.
Technology: The Super Sector
Year to date, net flows into Information Technology (IT) sector ETFs (including US and European domiciled funds) are more than four times net flows into all ETFs in the other ten sectors combined. This $21B net inflow indicates investor belief in this sector.1
A key reason for this investment is access the future growth of artificial intelligence (AI). IT sector constituents include the manufacturers of the chips necessary for building models, provide hosting services, and develop software for AI development. IT companies are also benefiting from the adoption of other new technologies such as cloud computing. The rapid pace of technological change has produced positive earnings surprises and improving earnings sentiment from IT companies over the last few years.
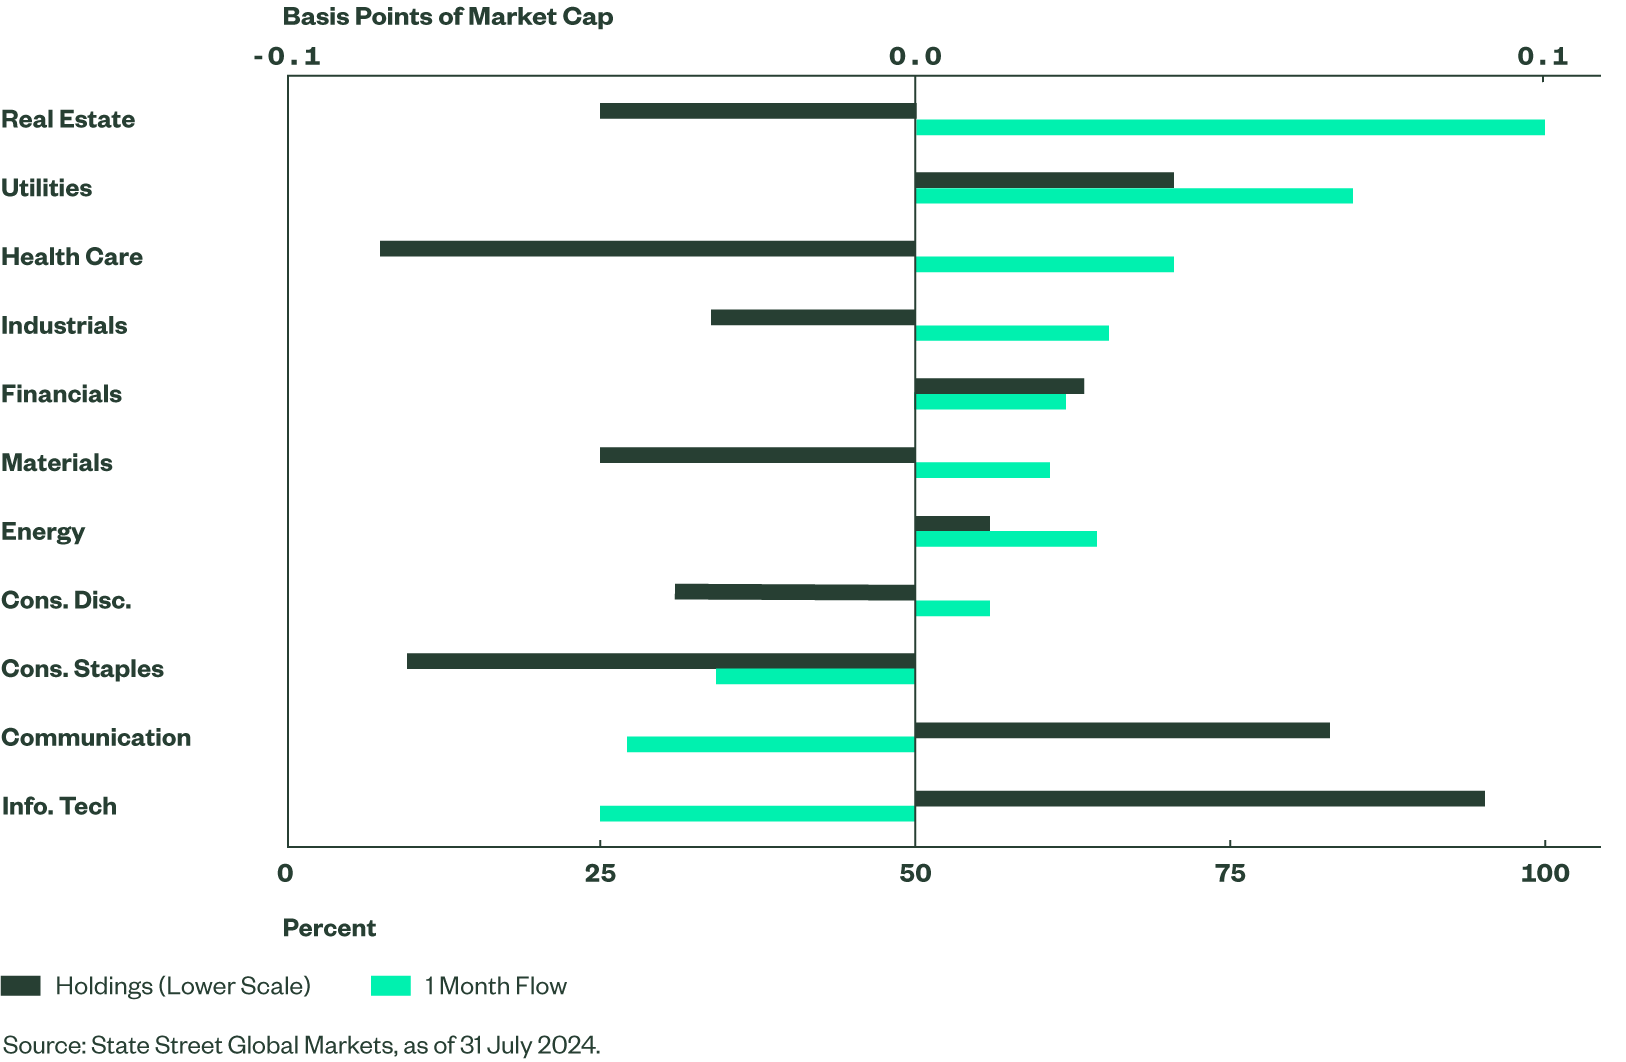
Amongst other groupings, institutional investors have built large positions in Tech companies and funds. Analysis of State Street Global Markets custody data (Figure 1), shows IT exposure is the largest overweight against client benchmarks, and interestingly there were relative outflows in July.
Figure 1: Institutional Investor Positioning in Global Sectors
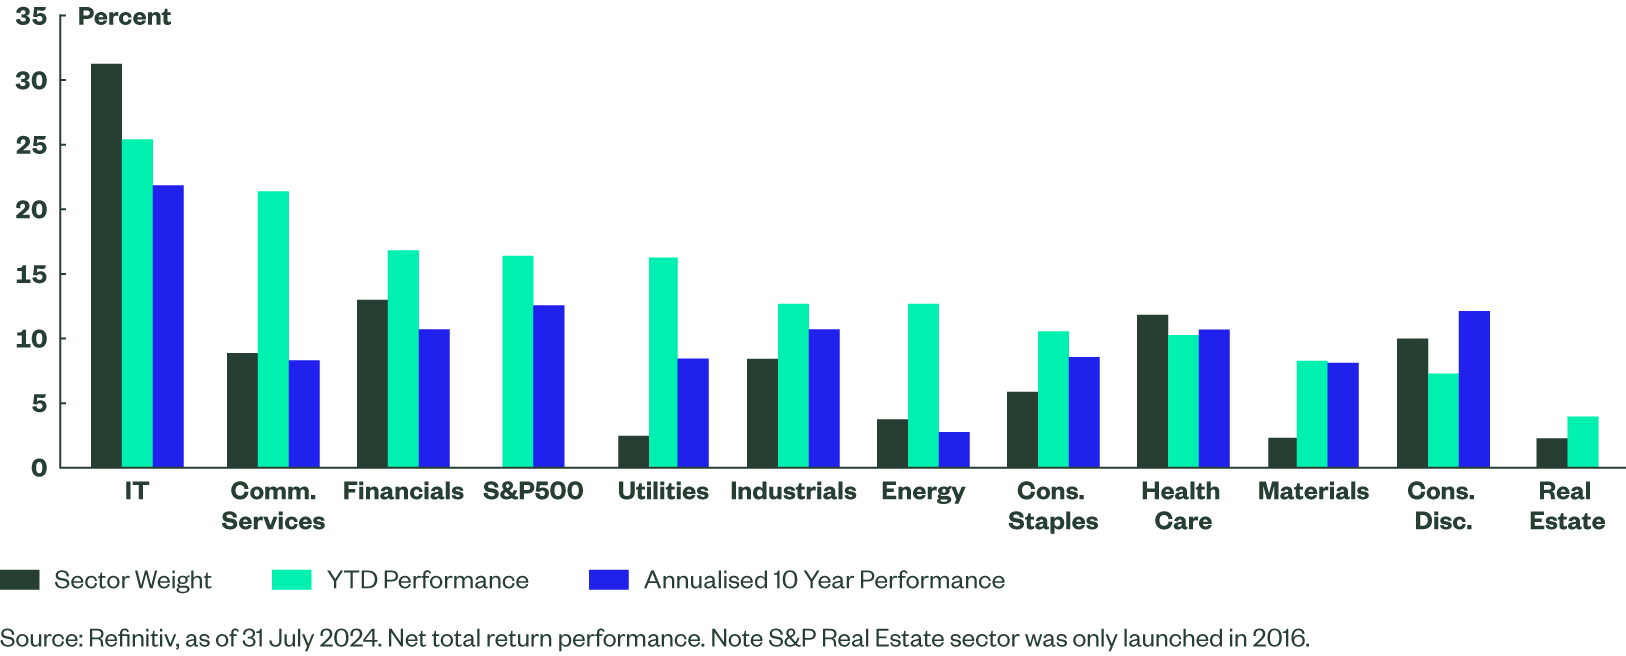
The performance of the IT sector is unrivalled by any other sector in developed markets for the last ten years, and so far this year. This is particularly evident in the US as seen in Figure 2.
Year to date, S&P 500 Index (market-cap weighted) net total returns are 16.4%, driven by improving economic and earnings growth. Even after recent weakness, the IT sector has outperformed by 9% outperformance and accounts for a significant proportion (45%) of the broad index gains.2 The next highest outperformance (5%), from Communication Services, is less meaningful given its index weight just a third that of IT, with attribution of 12% of S&P 500 returns.
Figure 2: S&P 500 Sector Weights & Net Total Returns Year to Date, 10 Years
What Could Cause a Sector Correction?
1. A Hard Landing for the US Economy
Figures so far this year confirm that the world’s largest economy is experiencing a soft landing. State Street Global Advisors forecast such moderation in US economic growth, accompanied by a falling inflation rate, in its Global Market Outlook. However, what happens if the landing hardens, or another event causes weakness and greater volatility in the equities market?
2. Worsening Geopolitical Environment
At the time of writing, we see heightened tensions in the Middle East and nervous relations with China, as well as the impending US presidential election as other factors which could upset market sentiment.
3. Valuation
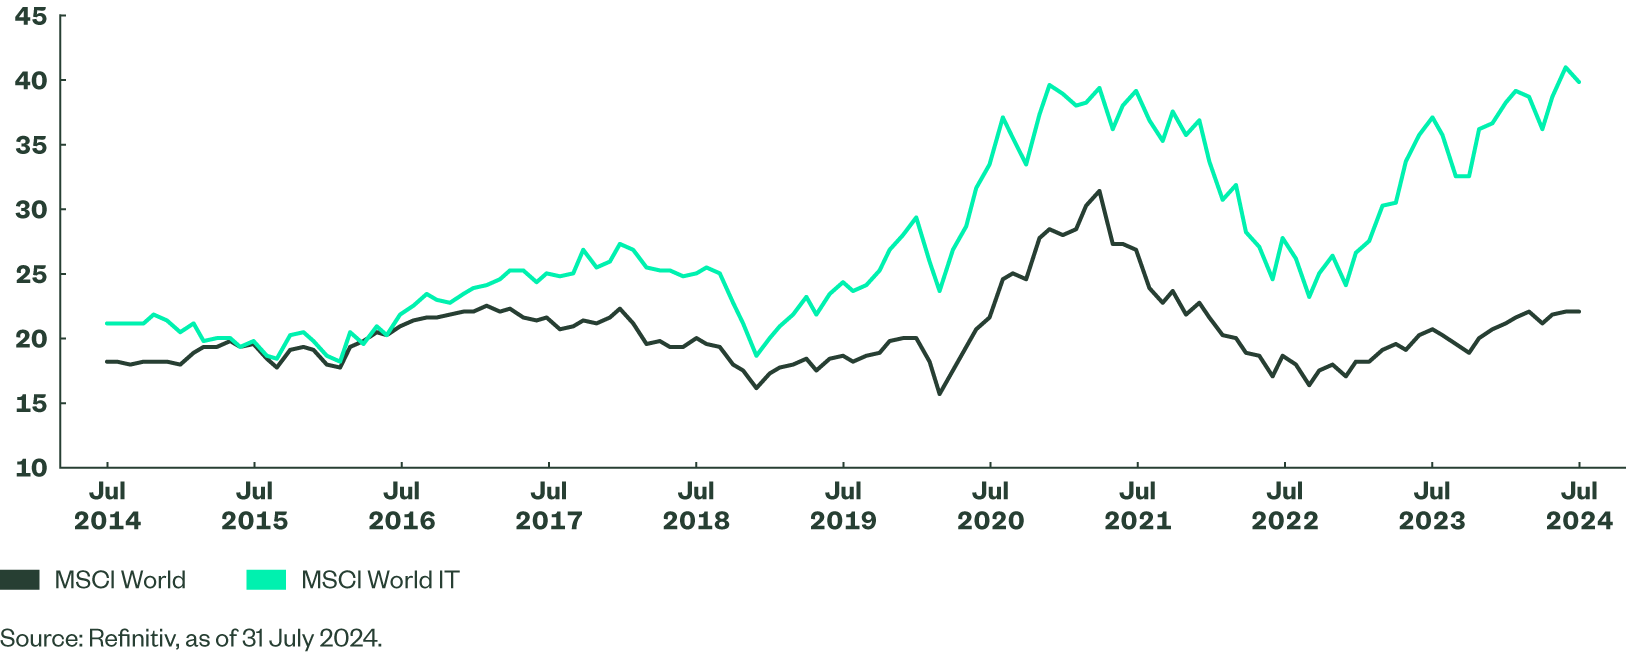
As Figure 3 suggests, price-to-earnings (P/E) ratings have risen for many stocks in the MSCI World Index over the past two years. IT ratings have run ahead, and the premium is highest for ten years. Whilst, elevated valuations are of concern, thus far they have been justified by premium growth levels.
Figure 3: P/E Comparison of MSCI World IT & MSCI World
4. Index Concentration
Significant outperformance raises concerns over how important the sector is to leading indices and causes anxiety over a potential bubble. IT’s weight is particularly high in the S&P 500 index (see Figure 4). Even though relative exposure is still small in Europe, it has more than doubled in ten years.
Figure 4: IT Sector Weight in Leading Indices

Using the effective number of shares to measure levels of S&P 500 concentration, we see the current low number of 53 indicates that the index is extremely concentrated. By comparison, the index was least concentrated at the end of 2014, with 145 effective shares, and 82 at the time the dot-com collapse in 2000.
Protect With a Defensive Addition
IT’s performance has been challenged this summer. This blip may well prove temporary in the long bull run, but it is time for some reassessment. Given the importance of IT, investors may wish to retain sector exposure to participate in long-term growth prospects but look to reduce risk.
We suggest that the potential benefits of combining an investment in the IT sector with one in a defensive sector include:
1. Reducing negative returns if there is a fall in the IT sector
2. Lowering average volatility
3. Ability to target specific exposures more effectively than adopting the broad index
We have found that the traditionally-defensive sectors — Consumer Staples, Utilities, and Health Care - as well as Energy, offer attractions in a barbell strategy. Defensive sectors have historically enjoyed better relative performance during negative market cycles and during recession.3 They also tend to be less volatile. Together, with Energy, these sectors show different investment characteristics than dominant in Technology, including growth, large size, and low yield.
Figure 5 compares the returns of holding US Technology with a combination of other sectors. Notably, all the options outperform the S&P 500.
Figure 5: Net Total Returns of S&P 500 Index, IT Sector & Barbell Portfolios (USD)
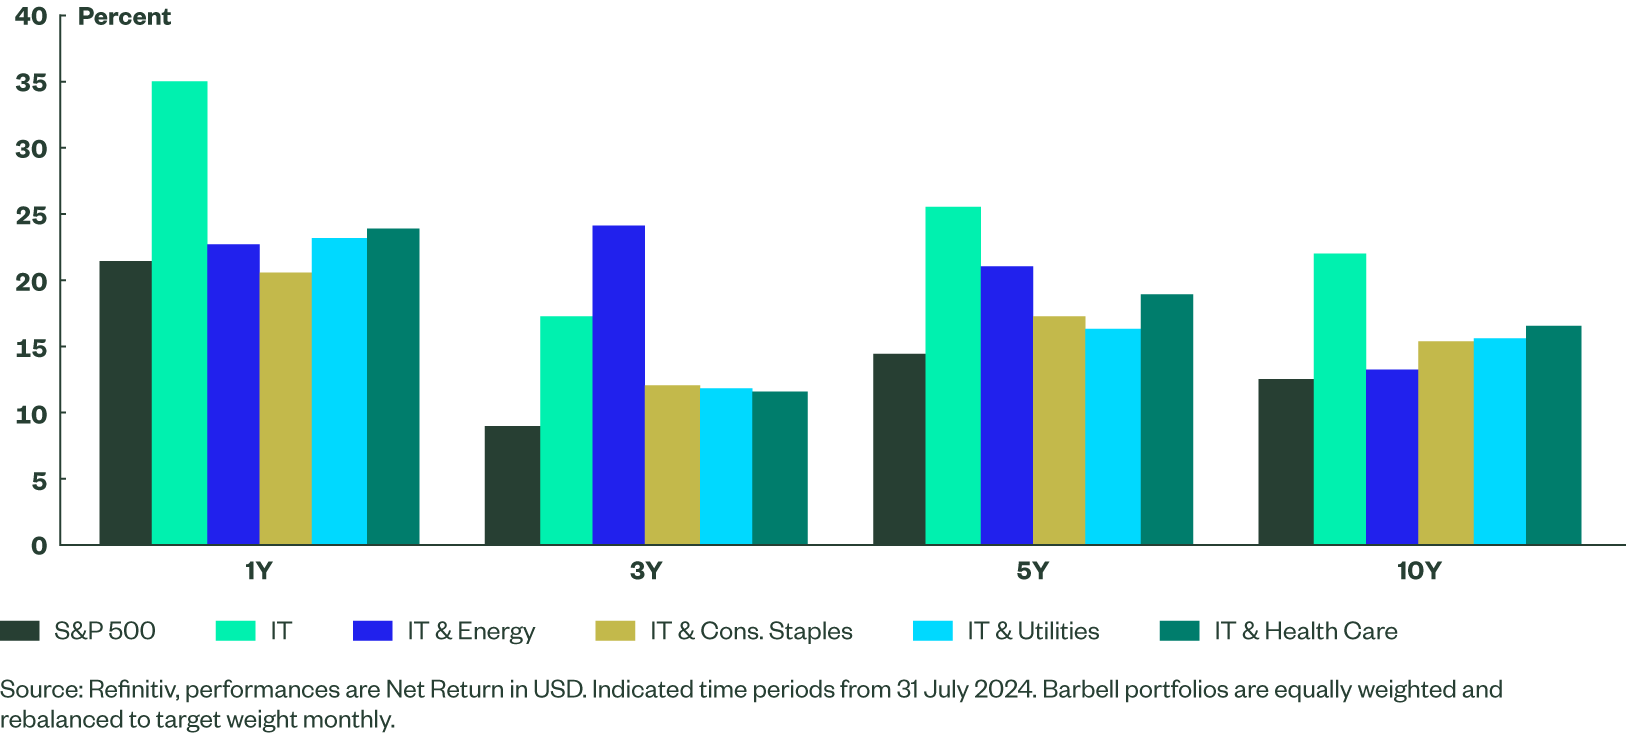
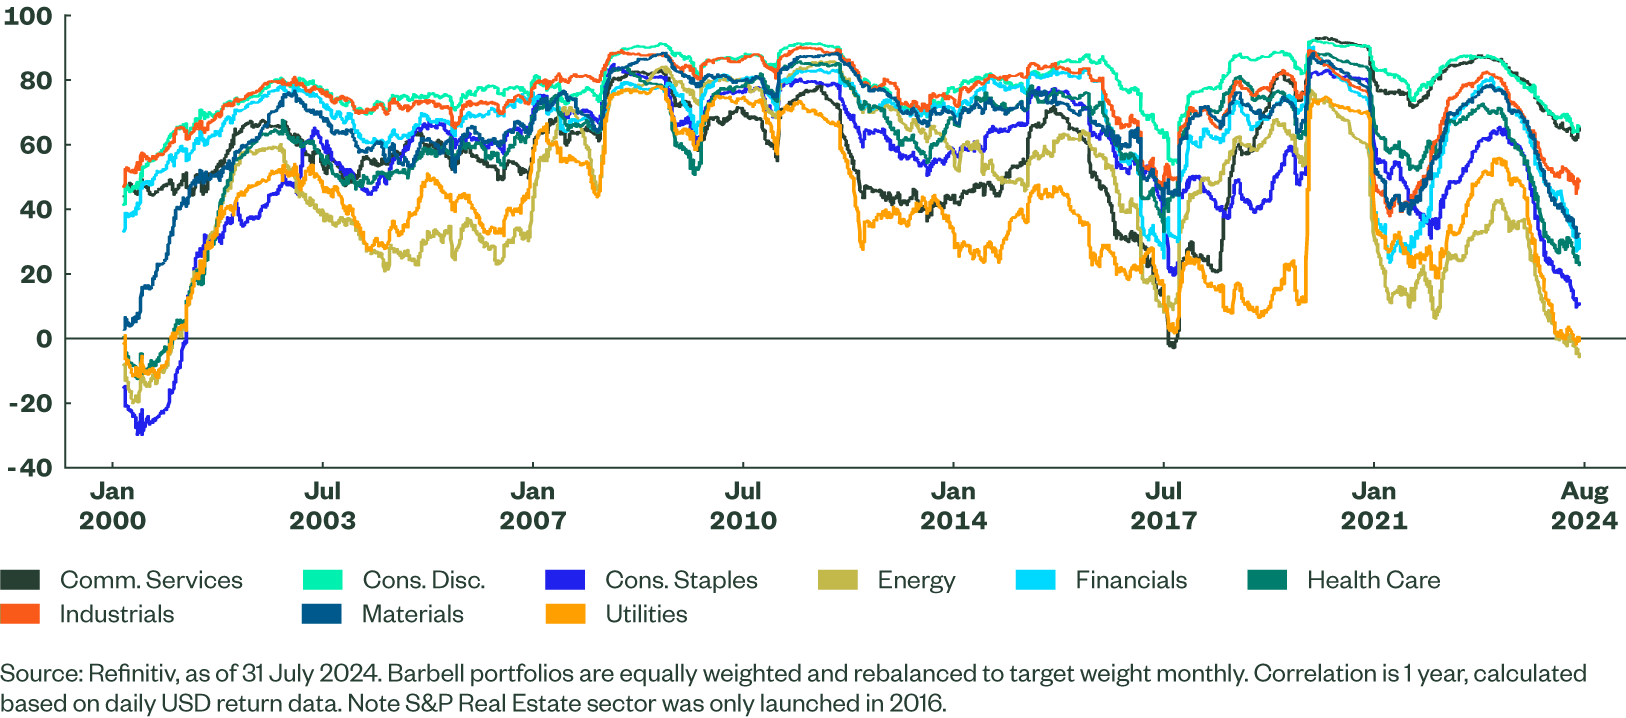
Figure 6 examines how a barbell of US Technology with a second US sector reduces average volatility, demonstrating the benefits of diversification. These results are best studied in combination with Figure 7, which shows correlations.
Figure 6: Volatility of S&P 500 Index, IT Sector & Barbell Portfolios (USD)
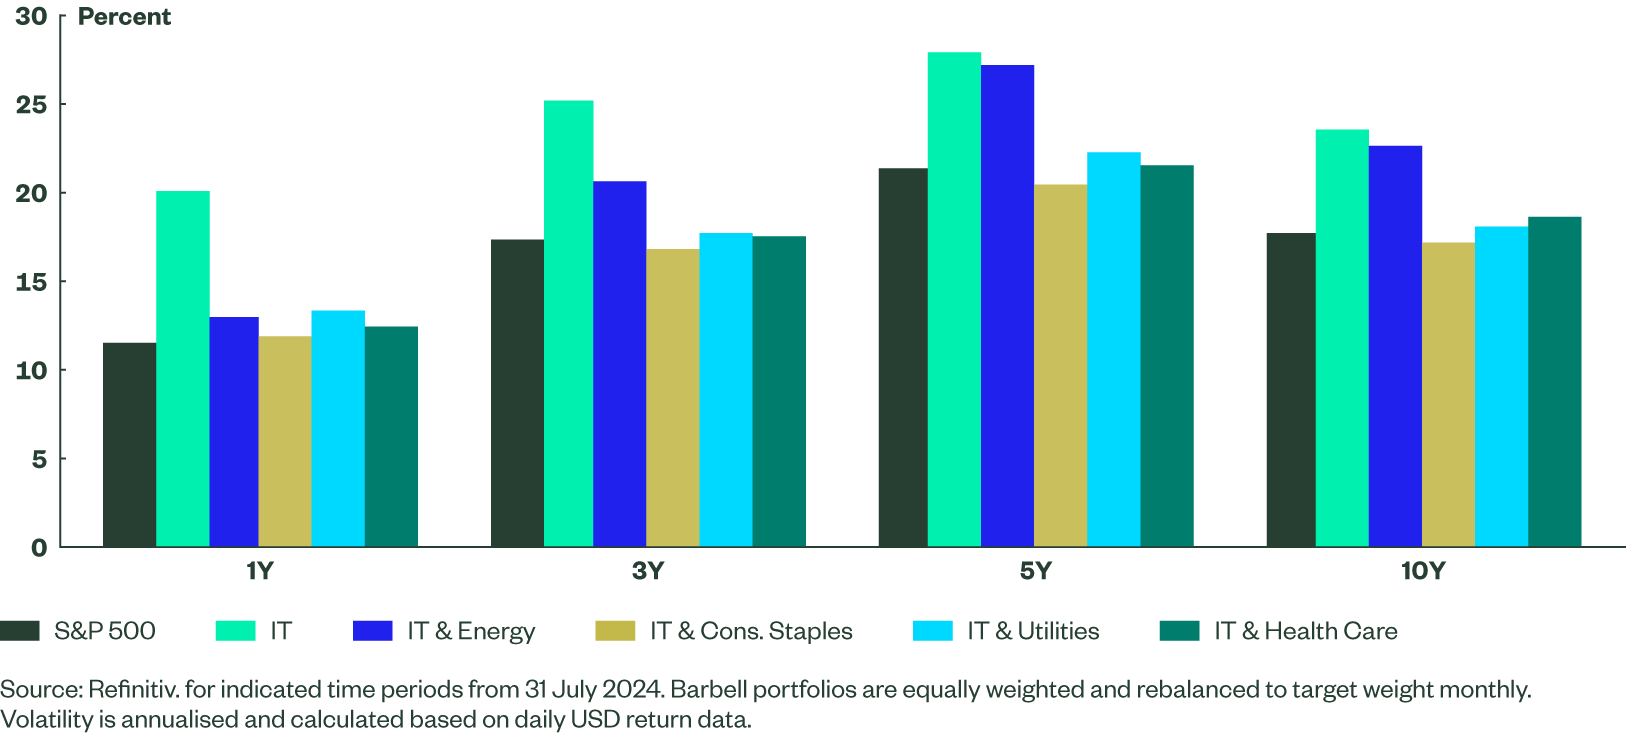
Figure 7: Correlation of S&P Technology with other S&P Sectors
Observations
1. We find the combination of IT and Utilities most compelling. The pair’s average volatility is consistently low, and one-year correlation is the lowest alongside Energy. Utilities have an emerging AI story of their own courtesy of the growing demand for electricity.
2. Despite Energy’s volatility being relatively high when considered alone, the barbell of IT and Energy gives lower volatility than IT on its own. This effective diversification is achieved because of extremely low correlation between the sectors.
3. The combination of IT and Consumer Staples gives lower volatility than the broad S&P 500 Index. As a defensive sector, where non-discretionary expenditure is important, Consumer Staples naturally offers relatively low volatility and a low correlation with IT.
4. The pair of IT and Health Care has produced attractive risk-adjusted returns. Health Care offers attractive structural growth prospects as global populations age and gather wealth, whilst the nature of its goods and services makes it defensive.
Analysis of Past Market Downturns
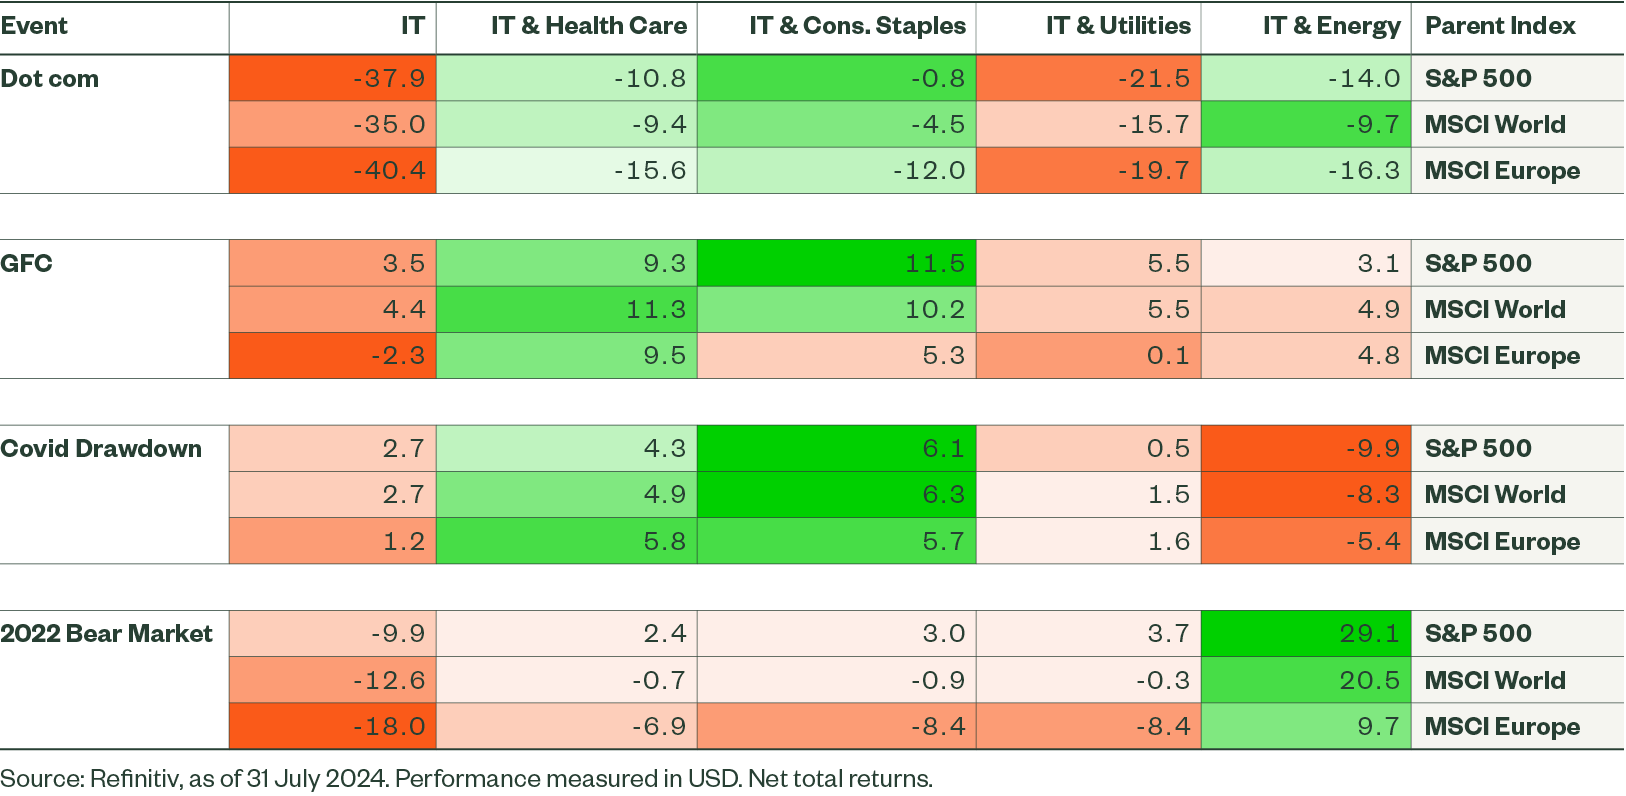
We evaluated four historical market downturns to ascertain how these pairings would have performed, as seen in Figures 8 and 9:
1. Dot-com Bubble (10/03/2000 – 09/10/2002)
The strong rise in markets at the end of the last millennium was driven predominantly by the TMT sectors and hype surrounding new internet companies (often rated purely on clicks rather than sales). This bubble burst spectacularly as faith in dot-com companies dissolved. IT fell sharply on an absolute and relative basis. All four sector combinations across the US, Europe and World would have produced better average returns than IT alone, particularly Consumer Staples.
2. Global Financial Crisis (31/12/2007 – 31/03/2009)
A significant credit bubble built up in 2008, with leveraged loans being amongst the culprits. Problems spread swiftly from US housing throughout the global banking system to impact real-world economics. All sectors struggled as the S&P 500 Index fell 44.5% in five quarters.4 Technology was hit by a lack of funding for new ventures and capital expenditure. In this case, holding Consumer Staples or Health Care with Technology in the US, Europe, or World would have afforded some protection.
3. COVID Drawdown (19/02/2020 – 23/03/2020)
Stock market performance was very volatile in 2020. Equities suffered sharp falls in February and March as the WHO called the virus a pandemic and shutdowns started. Market recovery was rapid in the following quarters, but it took a few years before economic impacts were neutralised. Energy was the worst performer in the downturn given the implications of less air travel and industrial activity on crude oil design. Meanwhile, defensive sectors lived up to their moniker and outperformed.
4. 2022 Bear Market (31/12/2021 – 31/12/2022)
The stock market fell in 2022 on poor global economic growth. IT struggled. As a lowly-correlated sector, Energy performance stood out, benefiting from rising demand for oil and gas amidst a supply-side squeeze post COVID restrictions. A combination of IT and Energy would have produced absolute gains for US and World sectors.
Figure 8: Net Total Returns of S&P 500 Index, IT Sector & Barbell Portfolios during Downturns (USD)
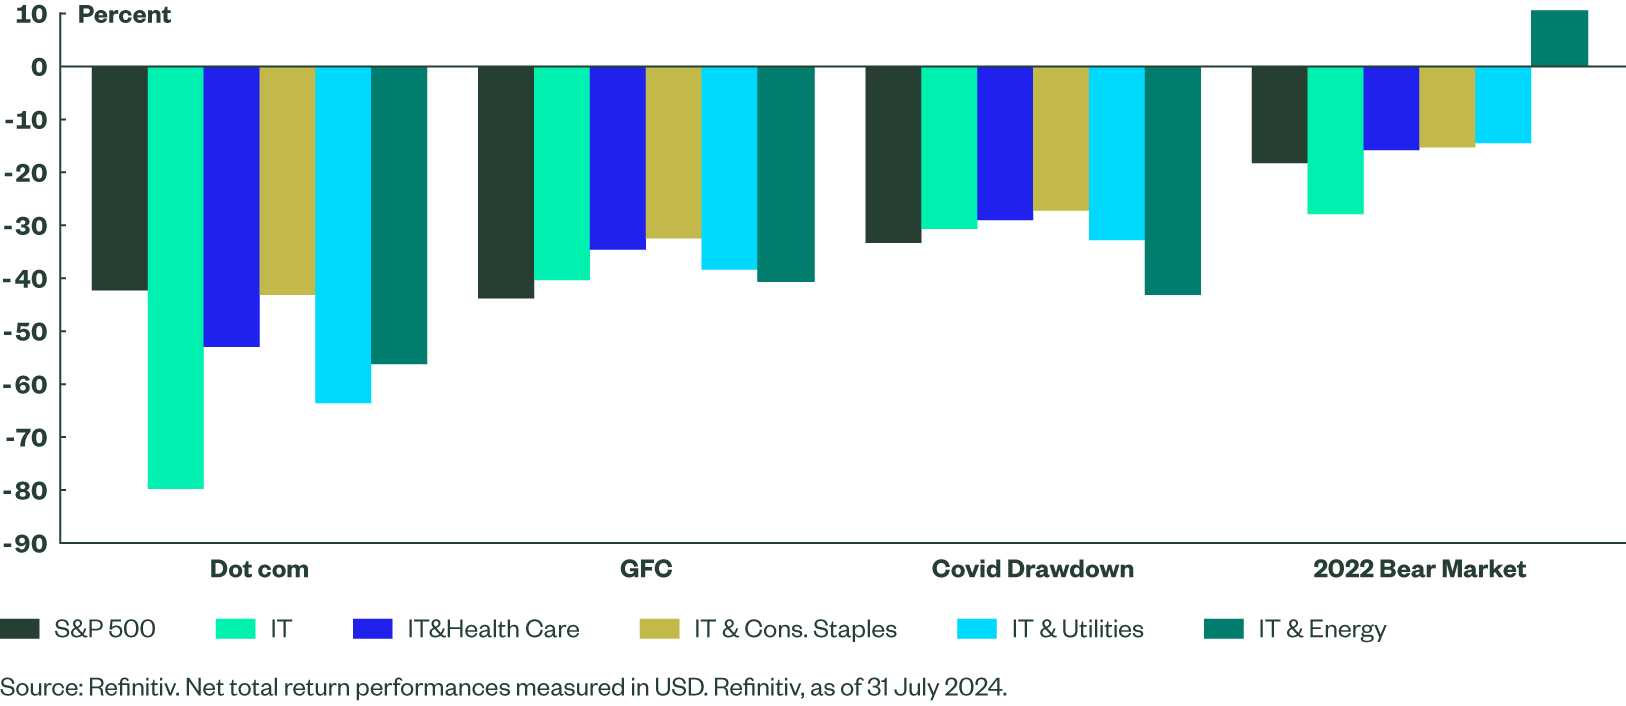
Figure 9: Excess Performance for Sector Combinations during Downturn Periods for S&P 500, MSCI World, MSCI Europe Indices (%)
The Bottom Line: Barbell Strategies Can Help Navigate Different Market Cycles
As shown above, additional sector exposure could have helped investors weather past short-term corrections in Information Technology. This simple analysis, of a 50/50 portfolio of IT and a second sector, demonstrates the diversification properties of a partnership. Investors can change the weights and add more sectors combinations to meet their own requirements.