Tipping Point: Is The RBA On Track For A Rate Hike?
3 reasons why we continue to see a hike or a prolonged delay in cutting rates as a policy mistake.
We note that recent data releases have presented upside risks in Australia with a potential for an annual reacceleration in inflation in Q2. That said, we believe the labour market is cooling fast and, inflation could actually decline into the Reserve Bank of Australia’s (RBA) target this year, sooner than they forecast. We still think a rate hike will be a policy mistake, as the economy is at a tipping point, where the unemployment rate could rise beyond their comfort level. Either way, with already feeble growth, the RBA will do well to exercise caution on their policy and proactively guide markets on their outlook.
The RBA faces a unique conundrum: whether to join the impending wave of rate cuts, or hold or worse, hike. Over the last six months, the narrative for monetary policy has remained on the hawkish side in Australia, as opposed to advanced stage discussions on rate cuts in other advanced economies. The primary reason is unfavourable data developments, often clouded by seasonality and one off factors. This lack of clarity in the data is reflected in the futures pricing of the RBA’s cash rate, which has poor record of forecasting the RBA’s actual rate decisions (Figure 1).
Figure 1: Futures Pricing of Cash Rate in Australia
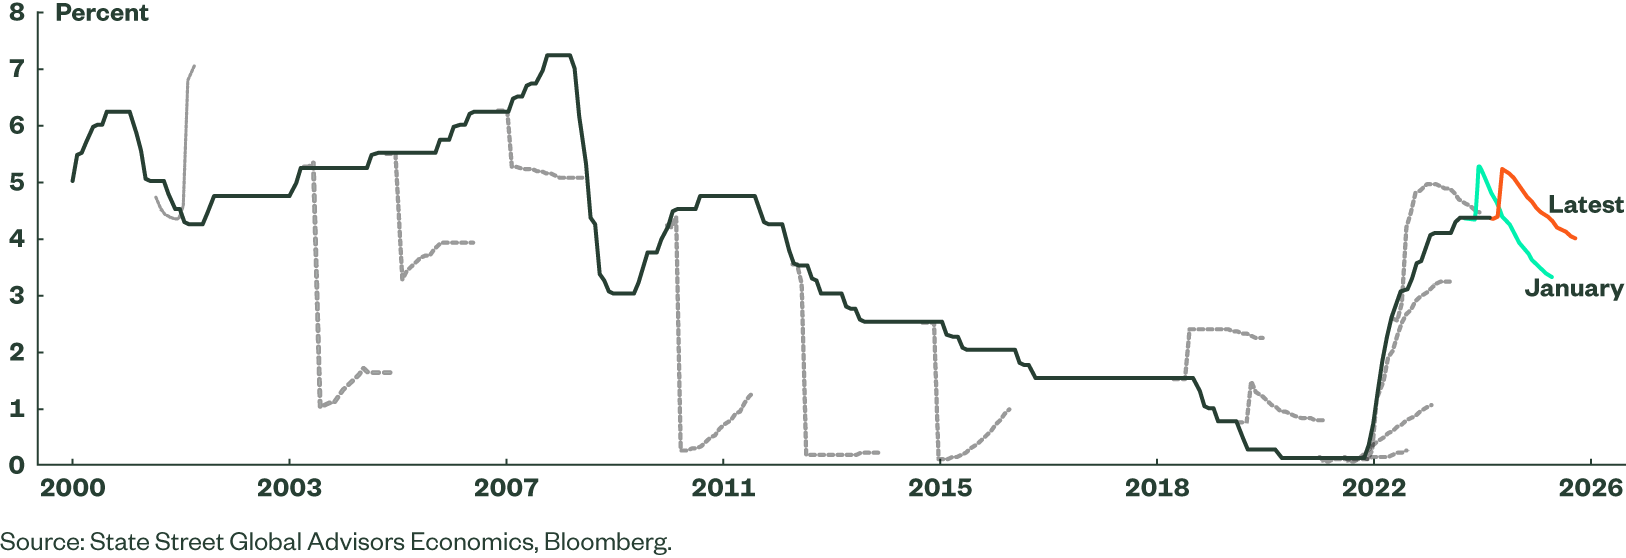
Even this market pricing turns back to signalling cuts after an August hike, which begs the question, what will this hike achieve? In the short term, the argument for a rate hike rests on the headline quarterly CPI for Q2 (due on July 31) rising above the RBA’s forecast of 0.8% q/q, which would translate into a reacceleration in the annual growth (Q1 CPI: 3.6% y/y). In contrast to this building consensus, we continue to see a hike or a prolonged delay in cutting rates as a policy mistake, for three reasons.
Reason 1: Labour market
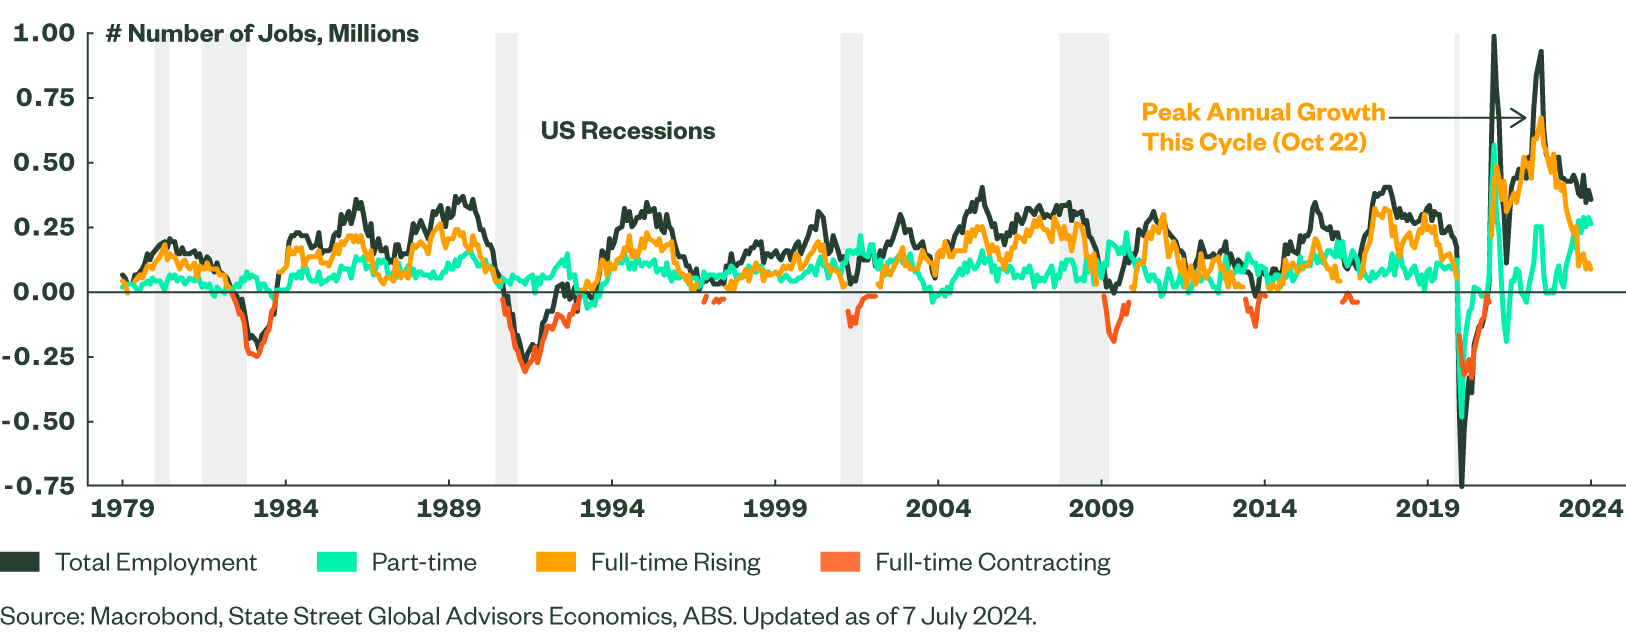
As we have written previously, Australia’s labour market does not lose jobs each month during downturns, which has helped the economy avert recessions during most global downturns. However, the employment picture is characterised by cyclical full-time employment i.e. full-time employment growth rises to a peak, and then declines, each and every cycle (Figure 2). In the current cycle, that peak was in October 2022; since then, the annual growth is down 80.9% as of June with the unemployment rate only rising to 4.1%.
Figure 2: Australian Full-Time Employment is Cyclical
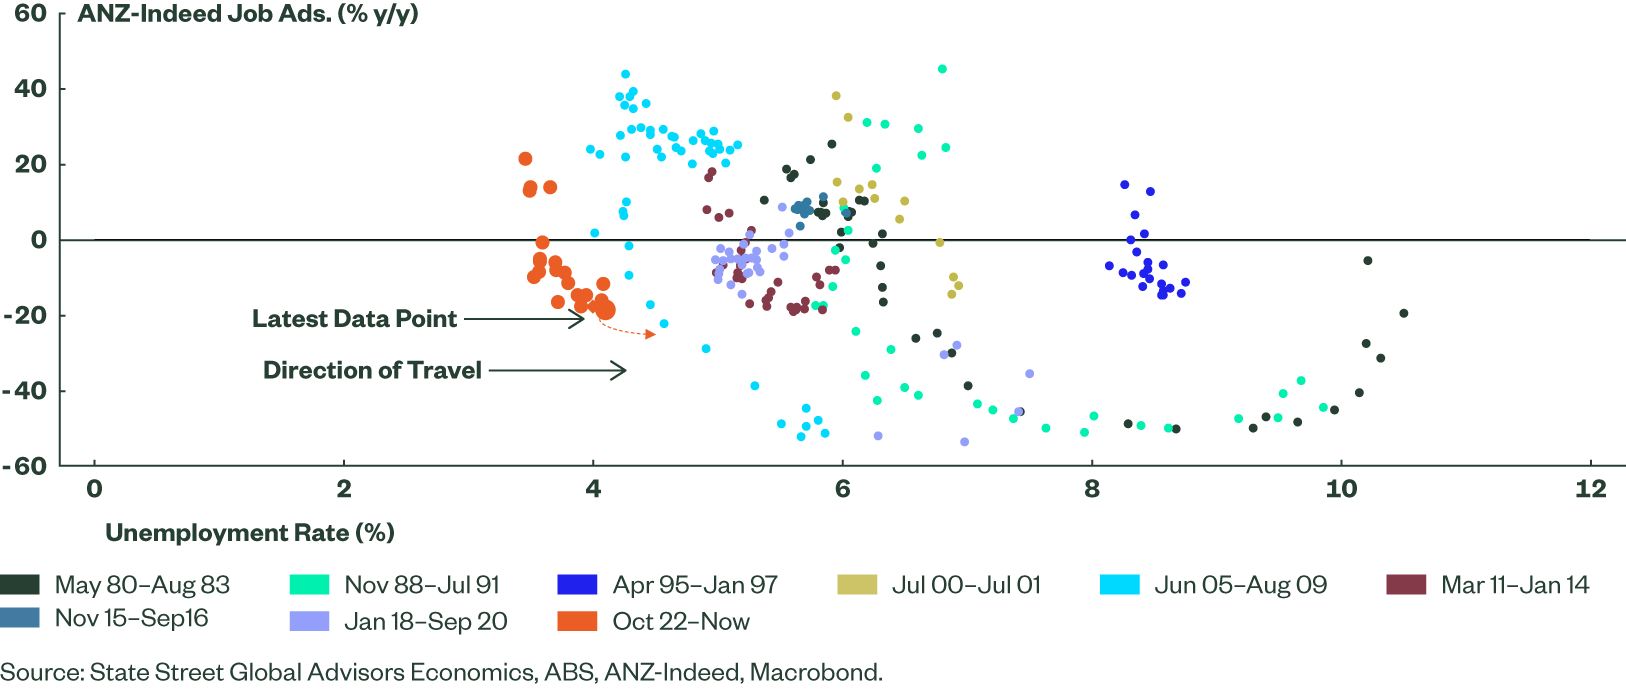
However, our analysis of the Beveridge Curve in Australia shows that the labour market is at an inflection point. The Beveridge Curve plots the negative relationship between job openings in an economy with its unemployment rate. The ANZ-Indeed Australia Job Ads Index is now down 26% from the peak in late 2022, and for five consecutive months through June.
We have identified nine cycles when the annual change in full-time employment declines. Plotting the Beveridge Curve during those times shows that, in the current cycle, additional declines in job openings will lead to higher unemployment rates (Figure 3).
Figure 3: Australia’s Beveridge Curve When Full-Time Employment Declines from Peak
Reason 2: Leading indicators of inflation
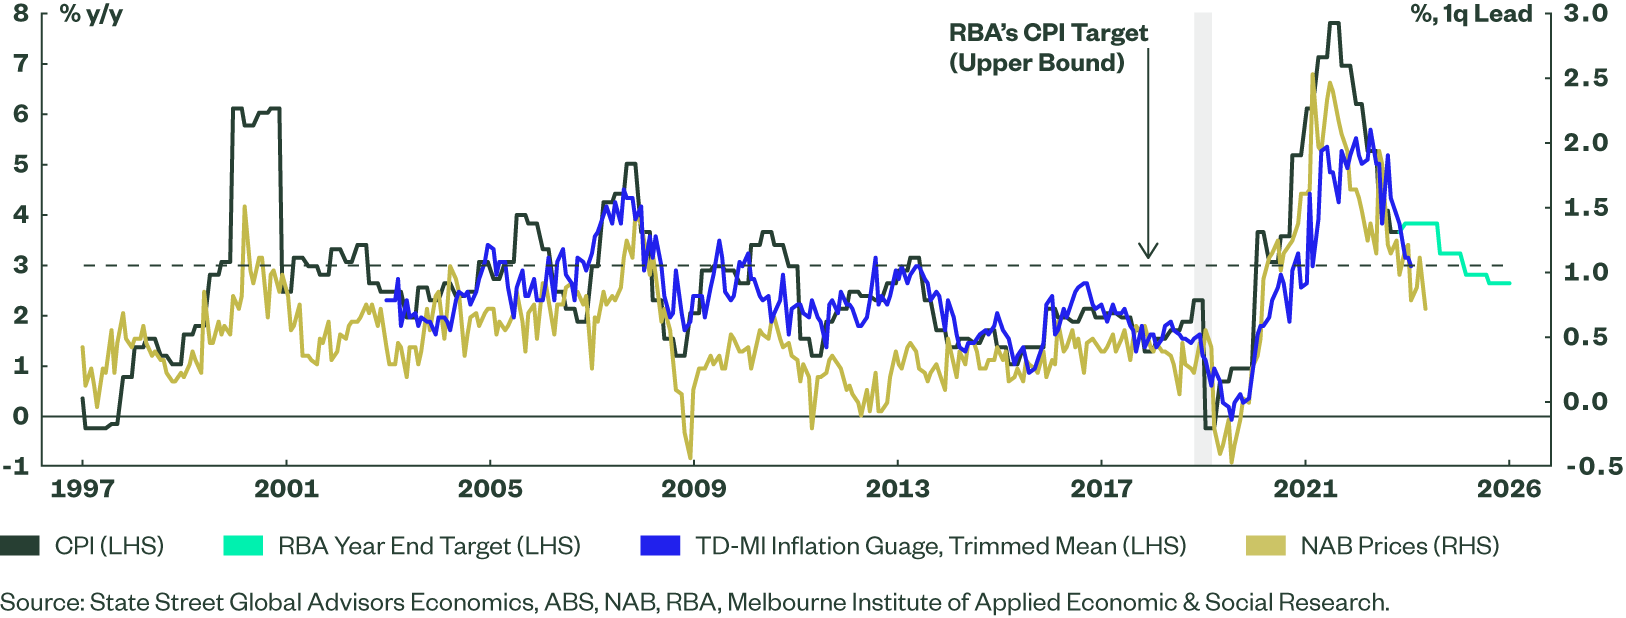
There are two reliable leading indicators for the headline quarterly CPI: the prices metric in the NAB Business Survey, and the TD-MI Inflation Gauge. Both of them show that inflation is on a downward trend and could very well decline into the Bank’s target range of 2-3% sooner than expectations (Figure 4). We expect that to happen in 2024, with a tailwind from an extension of energy subsidies from July.
Figure 4: CPI Within Target In 2024
Reason 3: Weak growth and consumption
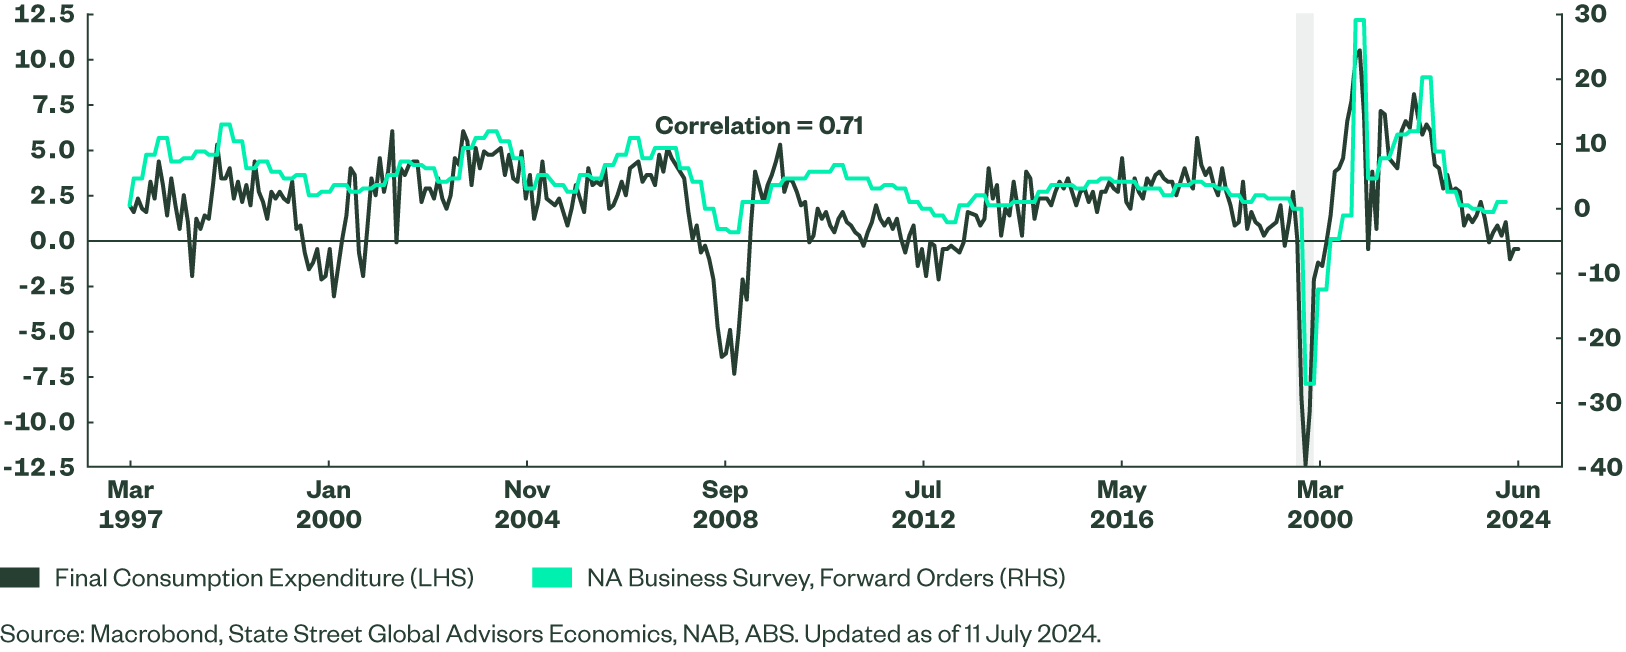
In addition to a hawkish bias, Australian markets may also have recency bias, and may have forgotten that GDP growth in Q1 was the weakest in 32 years in Australia (ex-Covid). Furthermore, consumption continues to remain weak, as tracked by the NAB Business Survey’s weak forward orders (Figure 5).
Figure 5: Leading Indicators of Australian Consumption Are Week
Our regular readers may not be surprised with this, as we have long been writing about Australian households having the highest debt servicing ratio of just over 18% among advanced economies. Australians perhaps have faster monetary policy transmission than other economies, simply as more than 85% mortgages pay higher flexible interest rates currently (according to IMF). Therefore any further hiking could exacerbate the situation and tip the economy into recession.
Against this uncertain backdrop, what should investors do? Since we published our Global Market Outlook (GMO) in December 2023, we have seen stickier-than-expected inflation and mounting geopolitical risks. This picture has not shifted. We believe many factors remain in flux and investors should focus on diversifying their portfolios. We continue to see fixed income as a bright spot for investors given current yield levels, slowing growth, and continued disinflation. We remain cautious on risk assets and favour quality stocks in equity markets. Most importantly, we stress the need to retain flexibility by holding more cash, or cash-like instruments to respond as clearer signals develop.