EM Equities at a Crossroads: Which Signs to Follow?
Emerging market (EM) equities offers investor exposure to parts of the world where growth remains robust and valuations are not stretched.
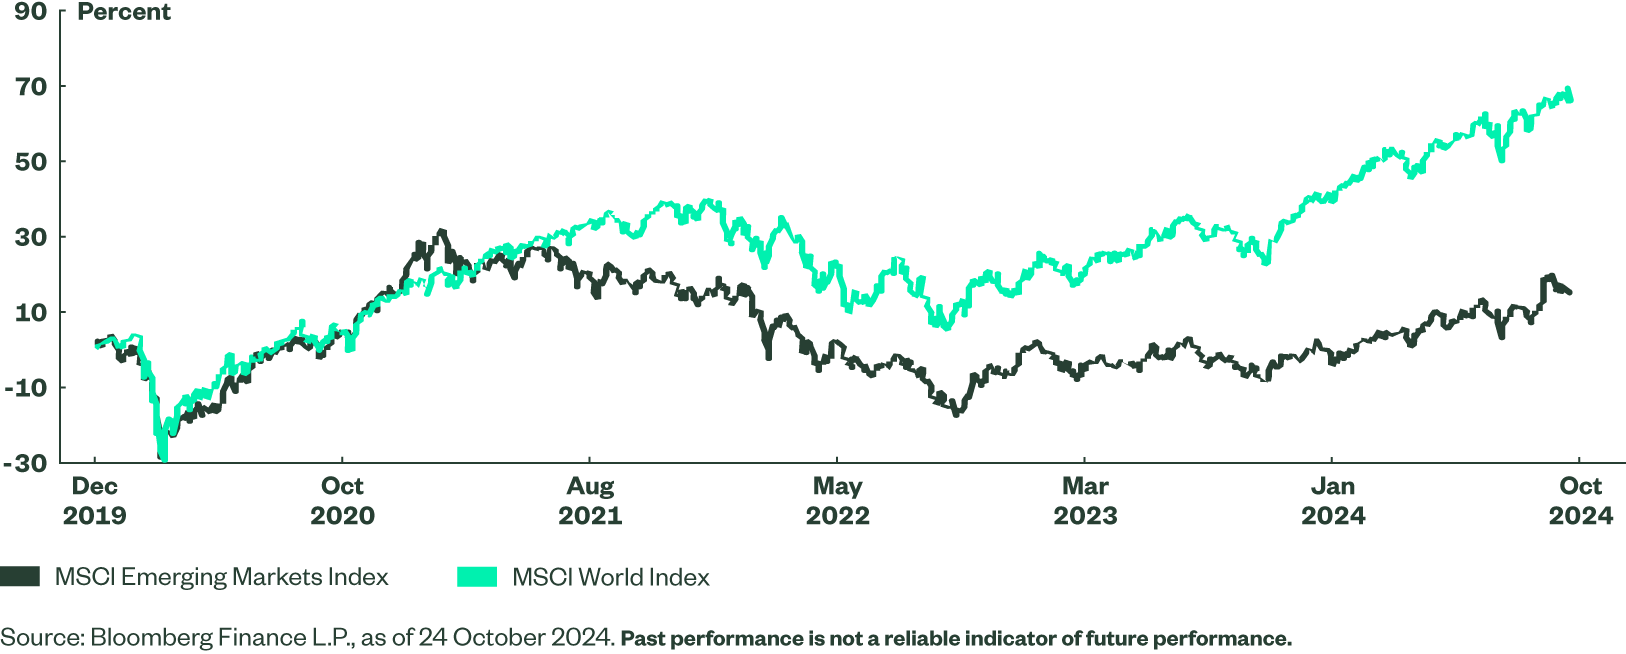
After a four-year period of underperformance, the global disinflation trend and potential fiscal stimulus in China both offer hope of an EM rebound. But recovery is not a given. There is tremendous potential for catch up — but investors will need to assess a number of factors and risks which will determine the future of EM equities.
The Origin of the Downturn
Emerging markets have been unloved by investors since late 2020 for two main reasons: China and inflation. China’s was afflicted by three internal setbacks: a regulatory crackdown on the technology sector, growing real estate distress, and the impact of the pandemic, where a zero covid policy was followed by a disappointing reopening. Both hampered domestic consumption.
Two external factors have not helped: Chinese reliance on trade surplus, and its geopolitical ambitions, increased tensions with the US, and Europe. Both elements have impacted equities from a market and from a fundamental standpoint.
The second channel was the macro driven. Rising inflation sparked aggressive monetary tightening, leading to a risk-off sentiment, exacerbated by Russia’s invasion of Ukraine. These factors have led to the appreciation of the US dollar and an oil price rise, and in turn greater investor scepticism towards EM financial assets, which tend to perform well in weak dollar and cheap oil environments.
The evolution of these drivers will determine whether EMs will continue to lag or will enjoy a long-awaited rebound. In particular, investors should monitor:
- The impact of China’s stimulus on domestic consumption and housing markets.
- The US easing cycle.
- Geopolitical tensions, including the US election outcome.
- Chinese internal policies.
Figure 1: MSCI Emerging Markets and MSCI World Index Performance
Short-term Drivers: Fiscal Policy in China and Monetary Policy in the US
In the short term, EM equity volatility will likely be driven by China fiscal policy (or lack of thereof) and by the Federal Reserve’s (Fed) monetary policy.
The nature, size and direction of China’s stimulus will be the crucial factor. Measures implemented so far include a 50bps cuts to reserve requirement ration, a similar cut on average on existing mortgages, CNY 800bn preferential lending to support buybacks, and the possibility of market stabilization fund. The stance of Chinese officials supports belief in further fiscal stimuli, with speculation of a Rmb10T ($1.4T) injection in the coming years. If that happens, a sustainable rally in Chinese equities is possible, turning the country from a laggard to a leader within the EM universe. Lack of concrete action would likely largely reverse September’s rebound.
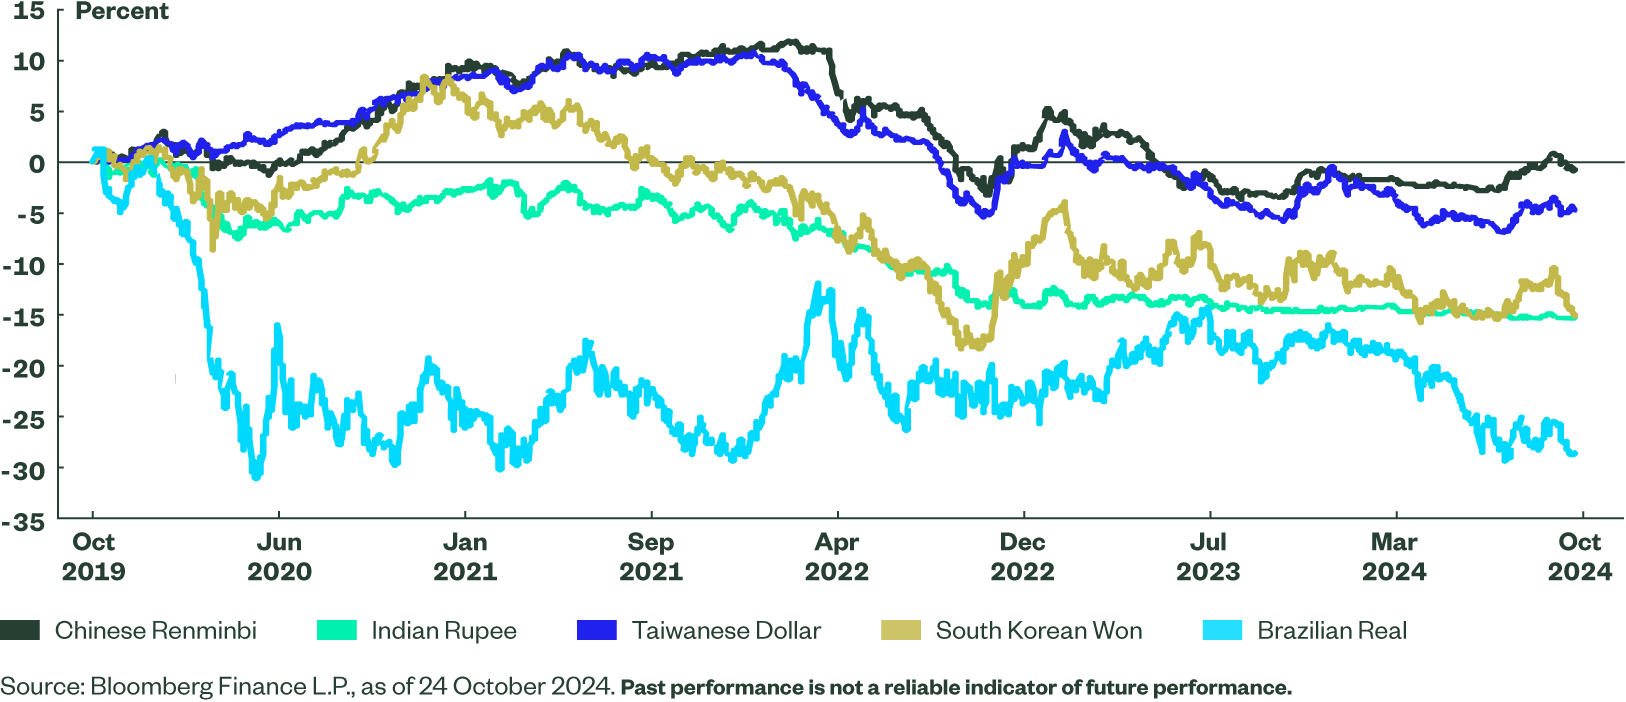
US disinflation and Fed monetary policy are also pivotal. The US easing cycle allows developing economy central banks to cut interest rates without depreciating local currencies too much against the US dollar. With rates in the US in the restrictive territory, monetary easing should continue supporting both EM equities and economies over the months ahead. Key EM currencies remain below pre COVID level, suggesting there may be a potential for reappreciation given policy normalization in the US.
Figure 2: EM Currency Returns Against the US Dollar
Long-term Potential — Economic Growth Advantage
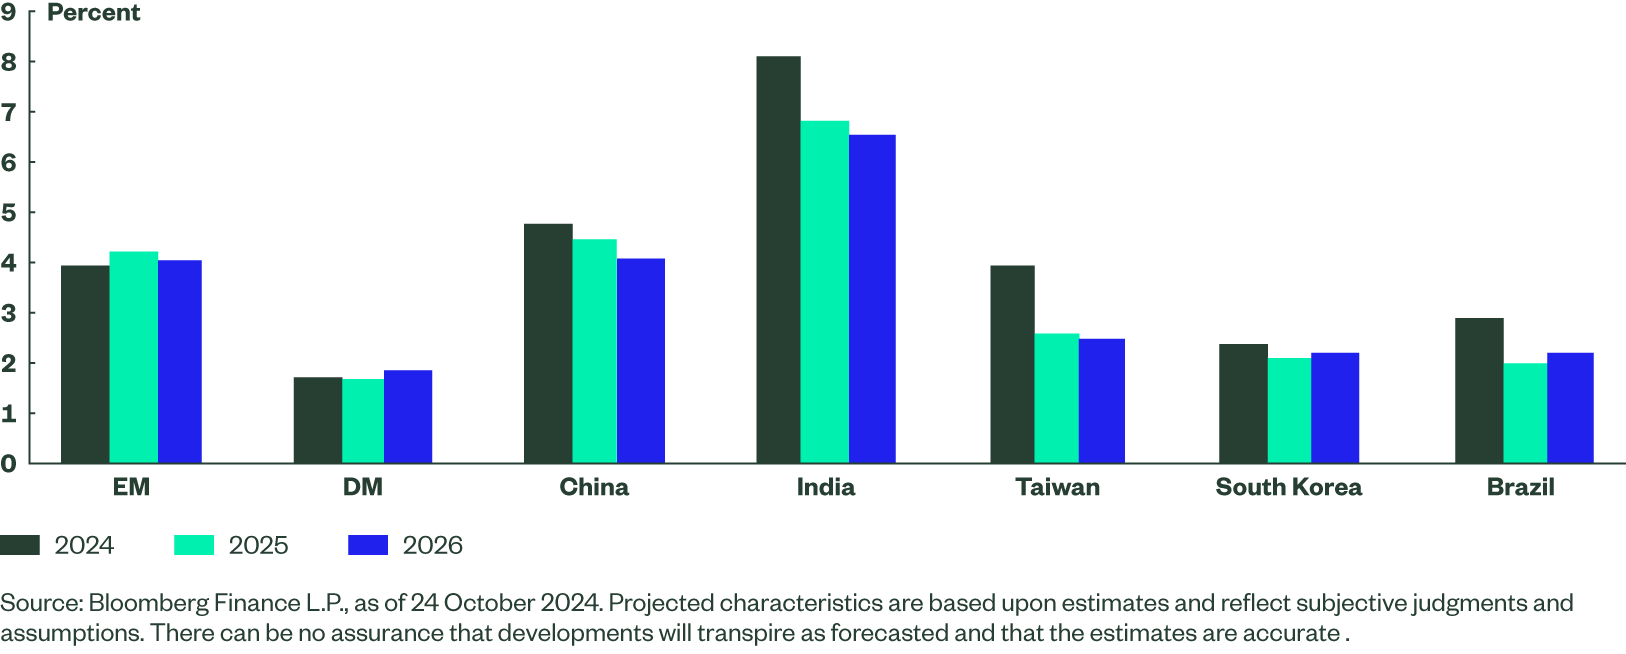
Investors are likely to continue to search for opportunities within emerging markets as these remain a pocket of growth in a world where developed economies (ex-US) are struggling to expand at a reasonable pace. China GDP is likely to continue to decelerate, although the 4.1%-4.8% growth rates penciled in by economists for the next three years are materially higher than 1.7%-1.9% forecasted for developed economies. India has taken the growth leader baton, and expanded by 8.2% in FY23-24. It’s now expected to grow at 6.9% in FY25 and 6.6% in FY26. Either way, EM Asia countries, with the “Big 4” being China, India, Taiwan and South Korea, remain the engine of the global growth (ex US?). They continue to dominate market-cap-weighted indices, representing 79% of the MSCI EM Index and 77% of the MSCI EM Small Cap Index1. Key LatAm and EMEA EM economies, i.e., Brazil, South Africa, Mexico, and Saudi Arabia, are also expected to grow faster than most developed markets.
Figure 3: Forecasted Real GDP Growth
Will Investors Reduce Their Underweight Positions?
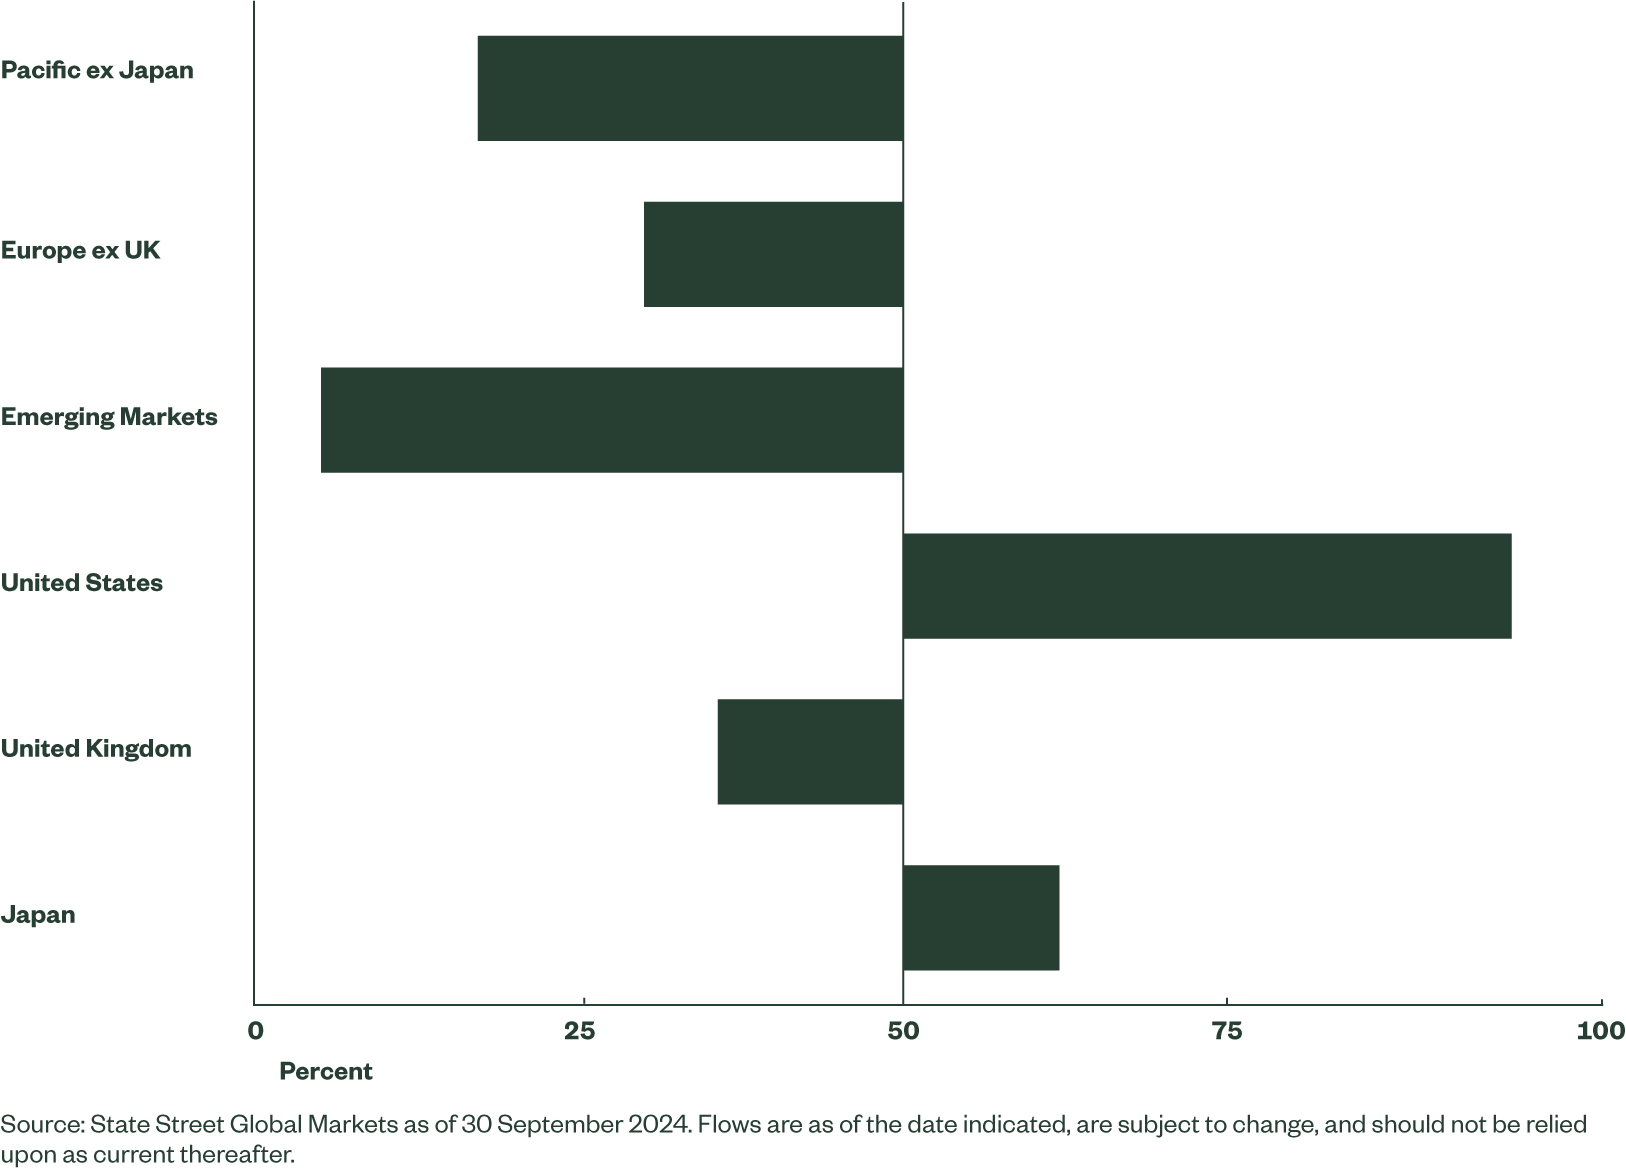
Institutional investors remain underweight in EM equities as shown in the Q4 Sector & Equity Compass. We believe that under a supportive market scenario, there is ample room for an upward move as investors may be keen to at least partially close their underweight positions. Material fiscal stimulus in China and continued easing in the US would likely improve EM equity sentiment.
Figure 4: Institutional Positioning
Valuation Metrics Remain Appealing
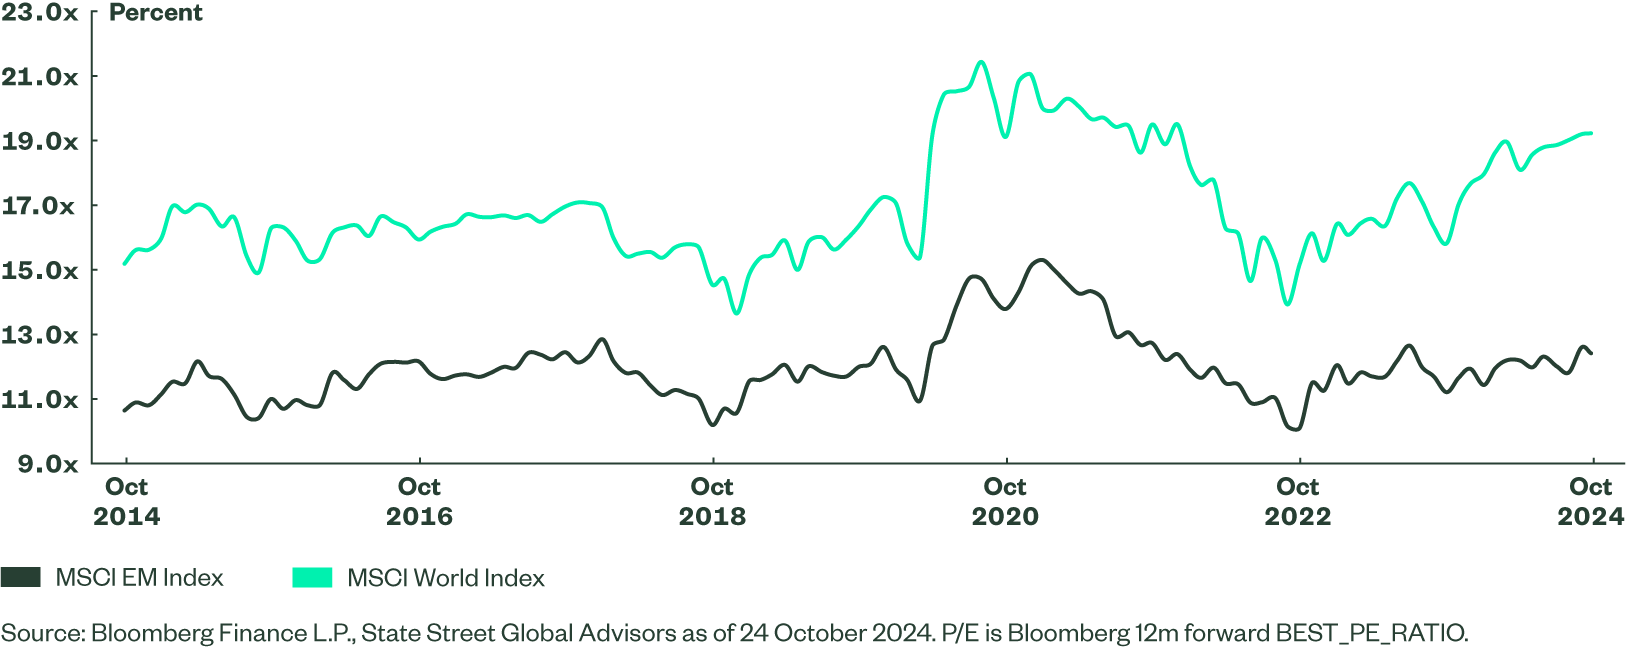
Large-cap equities in developed markets have rerated, reflecting soft landing and monetary easing expectations. Elevated multiples of developed large-cap equities limit the upside potential and introduce a level of vulnerability to any news flow that could undermine optimistic earnings growth expectations. In contrast, emerging markets trade at relatively undemanding P/E multiples — making them an appealing tool to play a “risk on” market scenario.
Figure 5: MSCI EM vs MSCI World P/E (1Y Forward)
EM Earnings: Great Expectations
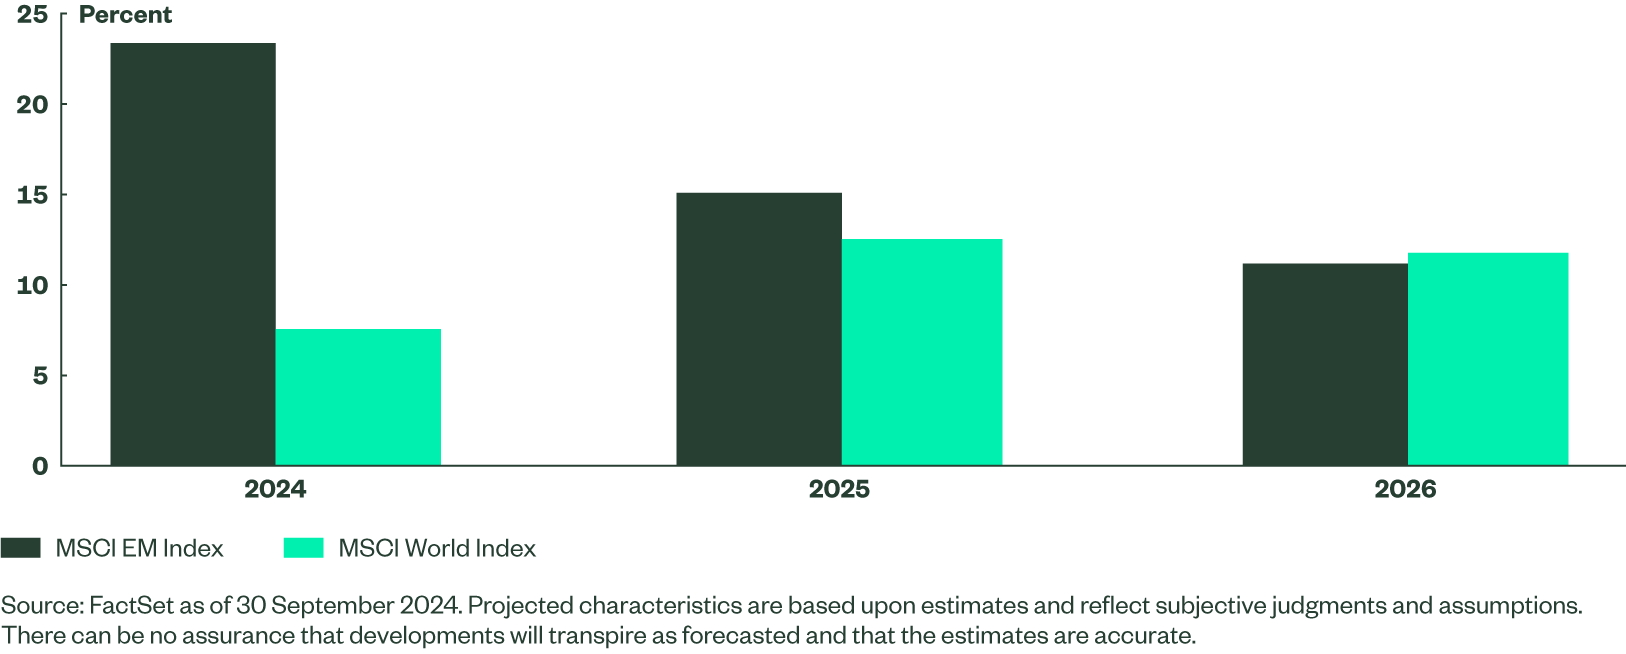
Sell-side analysts expect an earnings rebound for the MSCI EM Index from 2023’s low levels, when aggregated earnings contracted. Given the relative strength of underlying economies and the broader soft landing expectations, the EPS growth outlook for 2025-2026 does not look stretched. Bottom line earnings in the long term will be determined by macro and geopolitical factors. Upside and downside revisions are highly probable, with volatility most likely coming from China.
Figure 6: EPS Growth Forecasts
External and Internal Risks Lingering
EM equities have ample room for an upside move, but investors need to be equally aware of risks and headwinds which are very much present. China's scrutiny of its own technology sector and private sector in general may reemerge at any moment. It’s hard to predict a repeat, but investors should not forget the technology crackdown which sunk Alibaba, Tencent, Meituan and many other companies between 2020 and 2023.
China’s housing sector remains troubled and is over-levered. Lack of stimulus or a delay in stimulus increases the risk of deepening crisis across developers — and further deterioration in consumer sentiment.
Finally, China’s geopolitical stance has become more hostile to the US and Europe. This risks increased tariffs, particularly in the automotive sector. A broader deterioration in the geopolitical landscape, such as an escalation of conflicts in the Middle East, would be negative for EMs as a whole as it would dent investor sentiment.
Reflation in the US is a key external risk. We do not expect it as our base case scenario but reflation would likely lead to re-strengthening of the US dollar with all negative consequences which EM currencies and economies faced during the past few years.
EM Inflation Is Unevenly Distributed
Emerging markets are very heterogenous and the inflation challenge is not uniform. India is facing elevated inflation but monetary policy is already restrictive, and India’s economy is still expanding rapidly. Inflation in three other key markets — China, Taiwan and South Korea — is contained and not an imminent threat. Brazil is the exception, as the central bank has recently hiked interest rates for the first time in two and a half years. With that in mind, Brazil represents only 5% of the MSCI EM Index and 3% of the MSCI EM Small Cap Index. We do not see inflation as a main short-term threat for EM economies.
How to Play Emerging Markets
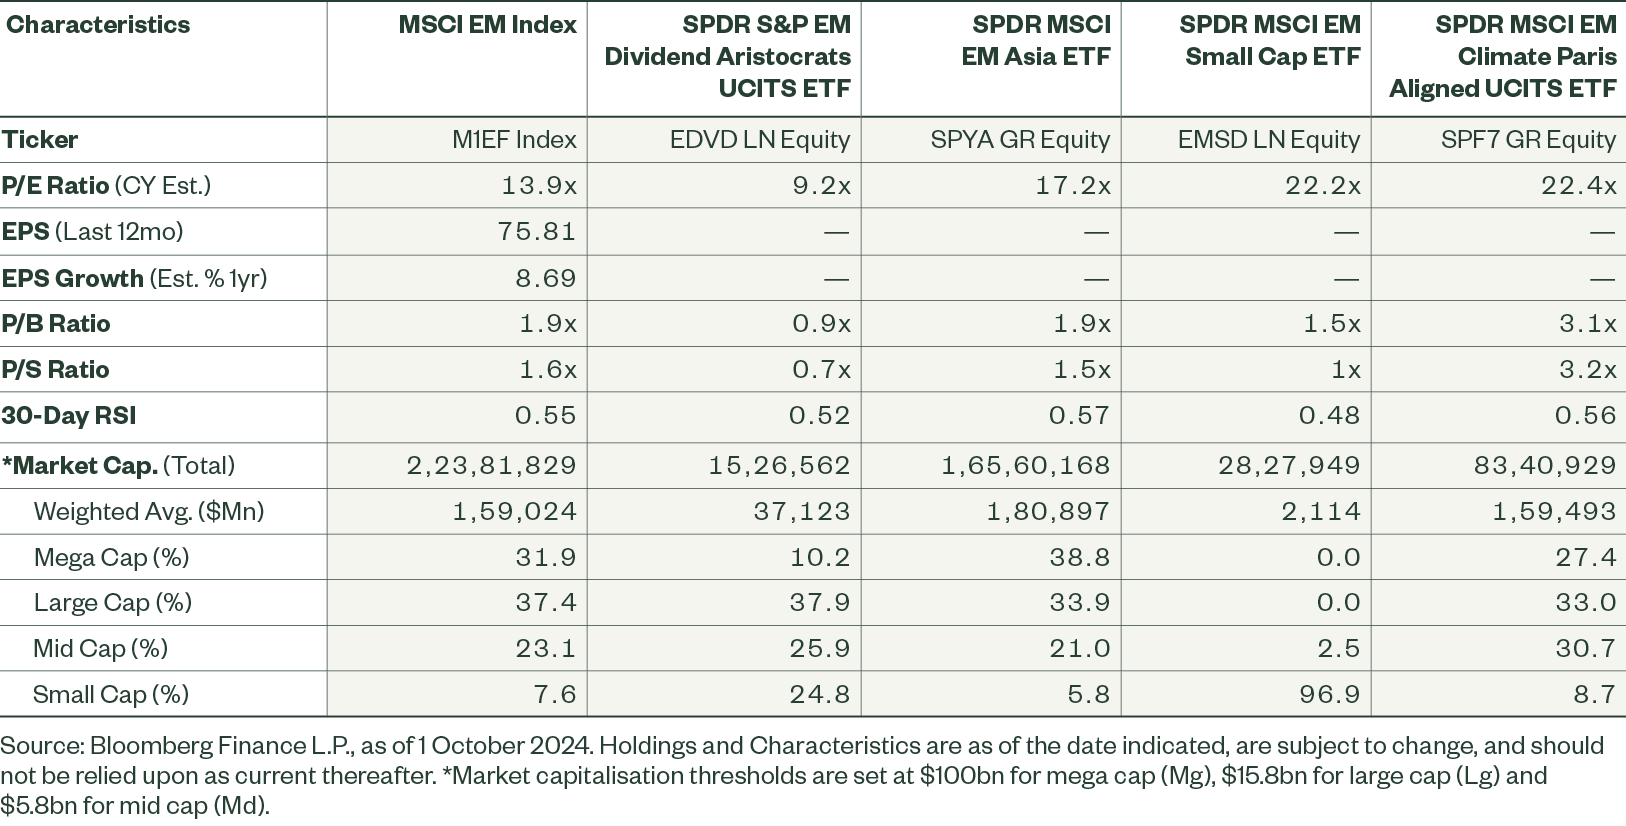
EM equities offer several merits which developed markets do not — including undemanding valuations, economic growth advantage, and catch-up potential. At the same time we believe EMs are at a crossroads and investors may want to position for an outcome they deem most probable. There are a variety of EM exposures which can be utilised to position for specific scenarios. The MSCI EM Index is the more broad exposure, with South East Asia representing 79% of the index. Most relevant countries in EMEA and LatAm, i.e., Brazil, South Africa, Saudia Arabia, and Mexico, complement APAC exposure with a commodity cushion.
SPYM GY
SPF7 GY
Investors with high conviction regarding fiscal stimulus in China may find MSCI EM Asia the most attractive solution because the country accounts for nearly 35% of the index. EM Asia exposure offers concentration on the engine of the global growth because China, India, Taiwan, and South Korea account for 94% of the index in total2.
SPYA GY
The MSCI EM Small Cap Index lies on the other side of the spectrum. It is heavily underweight China (9% of the index) and overweight India (30% of the index). It has been and remains a very interesting tool for investors who would like to embrace opportunities stemming from economic growth of emerging markets but who are more sceptical about prospects of stimulus in China.
SPYX GY
Emerging markets Dividend Aristocrats offer access to higher quality and more defensive stocks with proven ability to generate cash flow in a sustainable manner. As its exposure to China’s technology sector in China is non-existent, EM Dividend Aristocrats investors can play China’s rebound without much worry about potential regulatory scrutiny of the technology sector. Valuations are even more appealing than in the broad EM index.
SPYV GY
Figure 7: Country Exposure
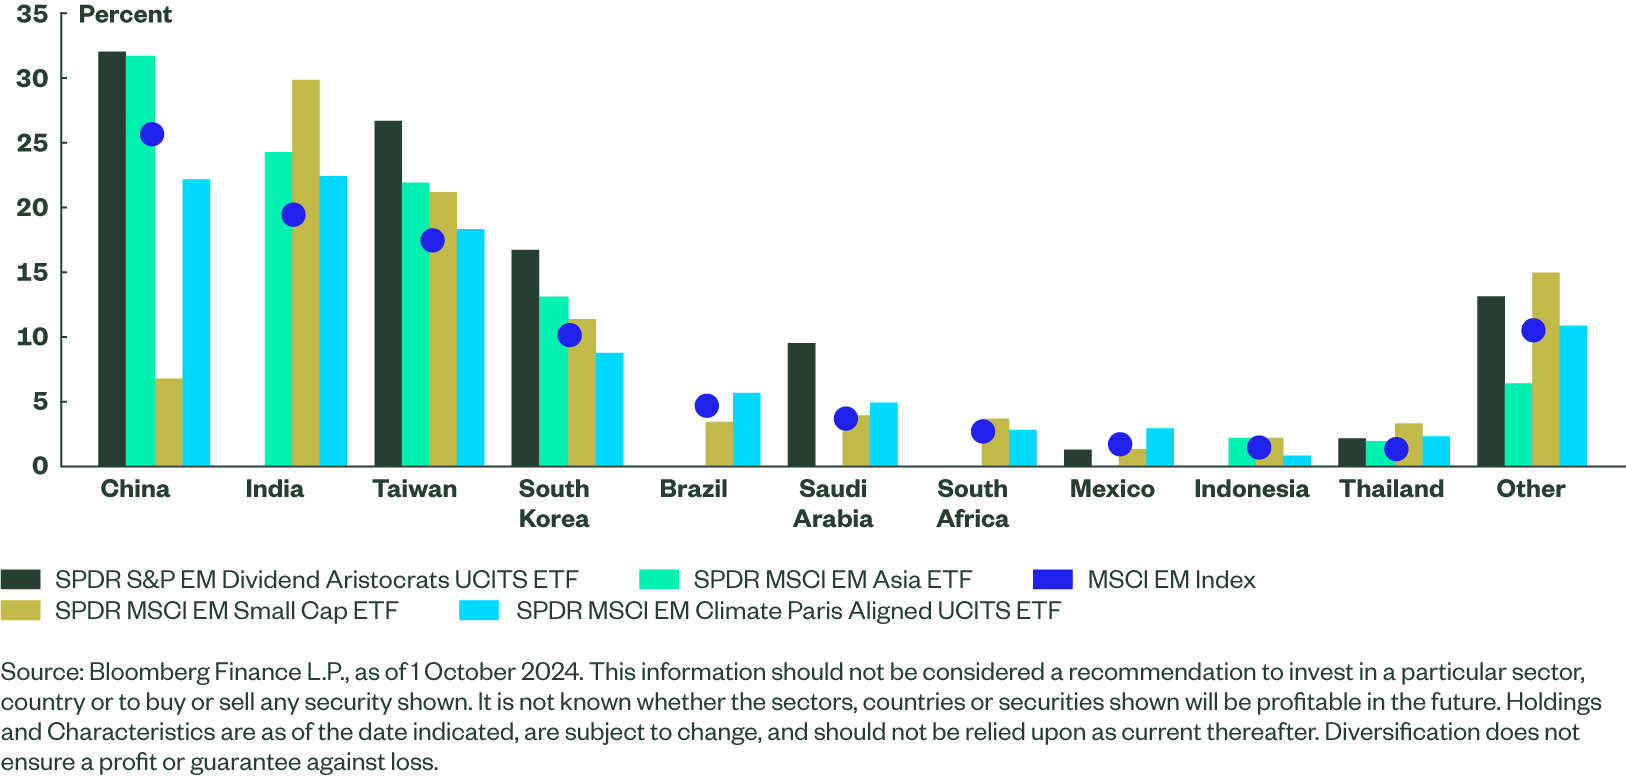
Figure 8: Sector Exposure
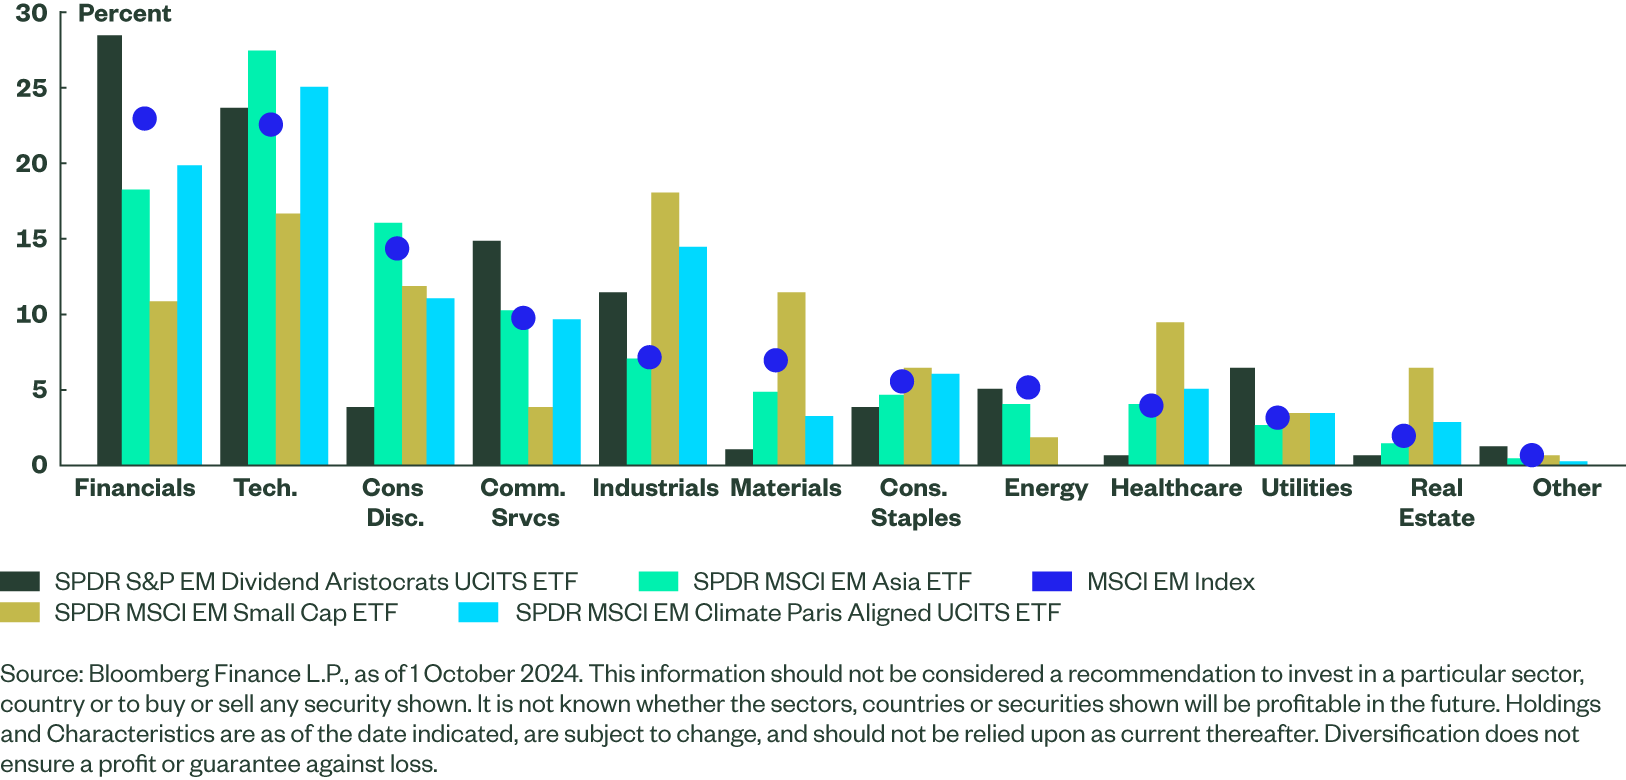
Figure 9: ETF Characteristics
