Convex — and Ahead of the Curve SPDR Global Convertible Bond ETF Turns 10
When the SPDR® Refinitiv Global Convertible Bond UCITS ETF was launched on 14 October 2014, the fund was obviously unknown, had no track record, and was the first ever purely physically replicated global convertible bond exchange traded fund1, so it was met with curiosity by some market participants.
A decade later, awareness of the fund has grown amongst the investment community, and we believe they are finding some advantages in using the ETF as a cost-effective vehicle, providing balance to their overall portfolios, delivering performance upside, and liquidity.
Ten Years of Asset Growth
Since inception the fund’s net asset value has grown to more than $1.46B — while gathering almost $950M of assets. The convertible bonds sector in Europe moved towards more long-only strategies and sustained outflows of $29.7B during the period. (See Figure 1).
The global convertible bond market has evolved since the GFC. Net issuance has lagged more traditional high yield and investment-grade corporate bond markets but there has also been a move to more long-only holders. This has helped funds like the SPDR Refinitiv Global Convertible Bond UCITS ETF grow rapidly as investors touted the transparency of this long-only, physically replicated global convertible bond fund.
The fund’s track record has attracted a regular stream of inflows from new and existing investors (Figure 1). State Street Global Advisors manages in excess of US$5B of convertible bond strategies primarily through its SPDR ETF offering.
Figure 1: SPDR Refinitiv Global Convertible Bond UCITS ETF
Cumulative Flows Since Inception (in EUR)
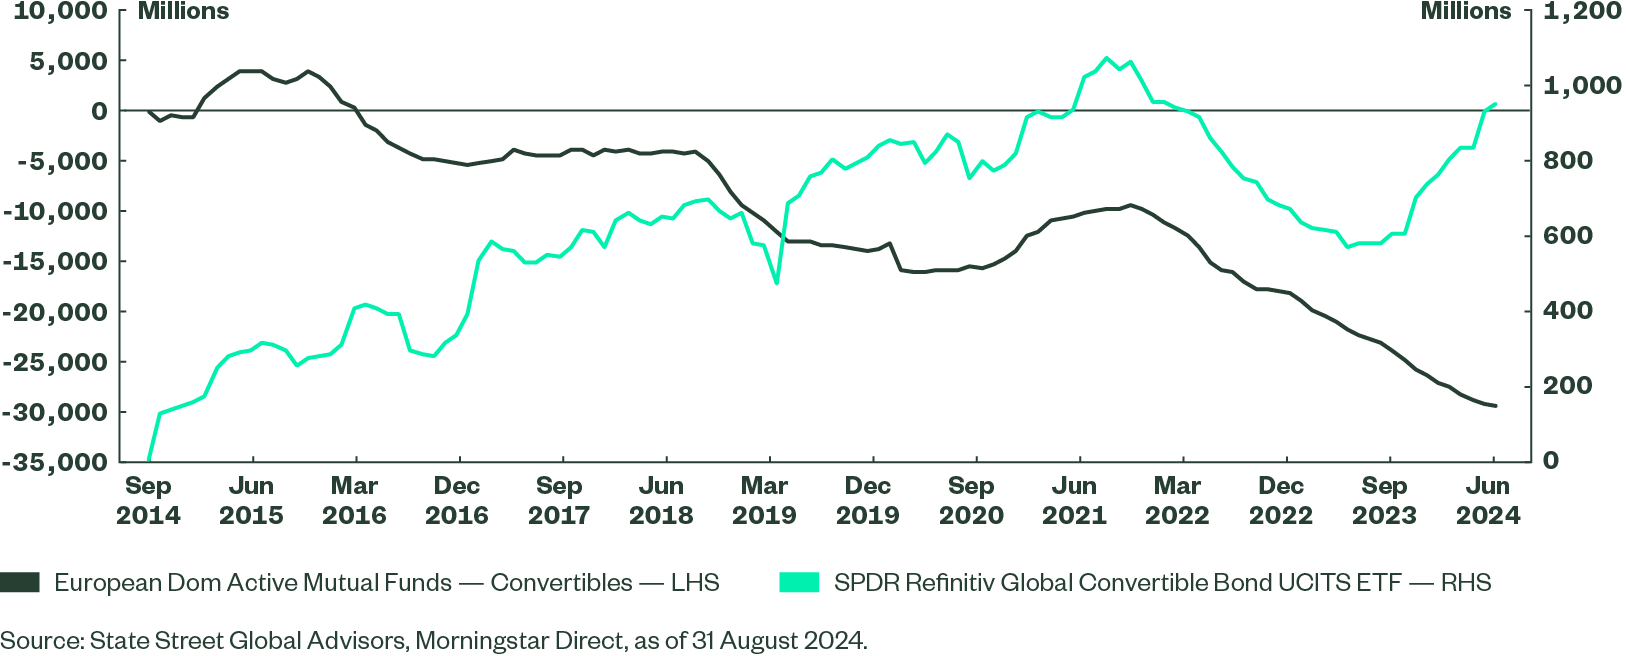
Figure 2: European Domiciled Convertible Bond Funds AUM Evolution (in EUR)

Convexity Over Time
Convexity is one of the attractive features that convertible bonds can offer. We often talk about the asymmetry of performance and convertible bonds have tended to capture on average between 45% to 60% of the upside performance of underlying equities while participating less to the downside with an average participation of 35% to 50%.
The graph below (Figure 3) shows the performance of the Refinitiv Qualified Global Convertible Bond Hedged Index versus its underlying equity parity index over almost ten years.
Figure 3: Convertible Bonds Performance Versus Underlying Equity
Asymmetry of Equity Performance Capture, Refinitiv Qualified Global Convertibles Index (US-hedged)

Active or Indexed? The Devil Is in the Detail and Index Performance Matters
The fund has a robust almost ten-year track record and in fact has outperformed the FTSE Refinitiv Global Focus Index — the preferred benchmark of active funds industry over the period. SPDR dedicates a significant portion of time to the index design. Of the $32bn of assets tracking global indices in European domiciled funds and ETFs, close to US$16B — about half — is benchmarked to the global focus family of indexes2.
However, the Refinitiv Qualified Global Convertible Index — designed in collaboration between the index teams of then Thomson Reuters and the State Street Global Advisors portfolio management, product and strategist teams — has outperformed the focus index in USD unhedged terms by ~260 basis points (bps) annualized over 10 years3.
The ETF has never been positioned as a direct competitor to an active strategy, as it aims to replicate the performance of its index as closely as reasonably possible, but index construction and index choice remain key to it success. The initial aim was to provide a broad and investable exposure to the global convertible bond market, representing how corporations are funded through this channel. Nevertheless, over the past decade the index has been consistent in providing upper-quartile performance when compared with the overall universe of convertible bond managers, which is dominated by active investors.
The Refinitiv Qualified Global Convertible Bond Index is honed to extract what we believe is a more exact beta of the global convertible market with four key principals at the core of its selection criteria: liquidity, cost efficiency, diversification, and skilled portfolio management. To this extent, it could be treated as a complement or alternative for investors seeking an effective global convertible bond exposure.
Convertibles: Why Now? Taking Stock of the Market
The Refinitiv Qualified Global Convertible Index has returned 8.69% year to date as of 30 September 2024. While far from the performance of global large-cap equity markets (18.66%), its performance has been closer to that of the global small-cap equity (11.02%) index, and it has outperformed many fixed income exposures thus far this year4. As a mix of both fixed income and equities traits, the convertibles index is delivering on what it was designed to do.
The market initially grappled with a confusing market environment this year, particularly in Q1. In a way, the market behaviour was a little reminiscent of 2023, with inflation remaining higher than central bank targets, forcing them to postpone rate cuts.
For the remainder of the year and going into 2025, a few scenarios remain open:
In a Goldilocks scenario of steady growth and lower inflation, duration could be a driver of performance. The majority of the underlying companies in the global convertible bonds index remain at valuations significantly lower than their highs. This means that convertible bonds would not only benefit from the duration moves, owing to lower rates, but also from the impact on underlying company valuations. Thus convertibles should also stand to benefit from equity participation. Convertible bonds are highly exposed to small and mid caps for circa 60% of the universe. It also exhibits a tilt towards growth companies (typical young tech, biotech, or consumer discretionary companies tapping the convertible bond investor community for their first “large” debt issuance). These are likely to benefit from lower interest rates, something we saw during the July rally following the lower-than-expected inflation print for June, and just after the Federal Reserve (Fed) cut the fed funds rate by 50 bps on September 18.
Spread compression appears less of a driver given the already tight spreads observed in the high yield space.
Figure 4: Global Convertible Bonds Performance Versus Large- and Small-cap Equity Indices
Cumulative Performance QTD in USD Unhedged Terms

Alternatively, a not-so-soft (even hard) landing scenario could be created if stubborn inflation forced central banks to stay on hold — or even hike rates — thus leading to a credit spread widening. In this case, convertible bonds would offer a more interesting opportunity than high yield and less equity sensitivity than a pure large-cap equity portfolio, given the relatively low valuation of the small- and mid-cap part of the portfolio (circa 60% as of end June 2024). Moreover, convertible bonds are a long volatility play and should benefit from a rise in volatility in a hard landing scenario. The low interest rate sensitivity (with a duration of around 2.7) compared with both global high yield and investment-grade indices provides some relative protection. Figure 4 also highlights the downside protection of convertible bonds relative to equities during the early August rapid sell-off following the JPY carry trade unwind and volatility spike.
The more likely soft-landing scenario of gradual rate cuts should benefit small- and mid-cap companies given their recent underperformance relative to mega-cap companies. This is due to the declining impact of higher rates on their financing needs, relative to large-cap blue chip names. We are now close to entering a more broad-based loosening interest rate cycle among developed markets. After the European Central Bank became the first G4 central bank to cut rates in June (and cut again in September), the Federal Reserve has now embarked with a 50 bp cut at the September 18 meeting, lifting risk appetite and small caps in particular. Therefore, the point at which investors will consider companies with a potential benefit from a steeper yield curve may have arrived, potentially leading to improved stock market performance towards yearend and into 2025.
Issuers have been returning to the market in 2024 with over $70B year to date. Convertible bonds are generally attractive for diversification given their different and sometimes unique sector profile versus traditional equity and bond indices. This is especially clear as the primary market has been very dynamic in H1, with $18+B in issuances in May, $13B in June, and $8+B in July. Diverse issuers helped increase the average coupon of the universe. We could witness more jumbo issuance across the market this year, following Alibaba surprising comeback with a $5B bond in May. Interestingly, there has not been any notable average quality deterioration that would suggest cash-strapped companies were turning to this market for financing. Most names are crossover-grade companies (between investment grade and high yield) funding growth development rather than deep junk companies looking for a lifeline. As the major central banks start cutting rates the issuance may slow a little.
Is the Increase in Default Rates in an Economic Slowdown a Concern?
The risk of default is rising given the deteriorating economic outlook. However, indexed investments can off the benefit of portfolio diversification to help limit idiosyncratic risk. In the Refinitiv Qualified Global Convertible Index, the weight of an issuer of cannot exceed 4% and the top 10 issuers represent less than 14% together. In total, there are more than 344 convertible bonds in the fund. Meanwhile the overall exposure to non-investment-grade credit in global convertible bonds is around 55%5.
Convertible Bonds in the Current Market
With higher coupon levels, a historically normalised rate environment, and a potential pick-up in volatility, balanced convertible investors are being paid to wait and are likely to benefit from pivotal thematic equity exposures such as artificial intelligence, healthcare and energy in the longer run, and simply from a continuation of the rate pivot in the shorter term.
Why SPDR Refinitiv Global Convertible Bond UCITS ETF
During its early life the fund was lesser known and still building out a track record, so it was met with some curiosity by market participants. They had rarely seen this type of strategy or structure succeed within the convertible bond space. Today, awareness of the fund has grown amongst the investment community, who are now finding some advantages in using the ETF as a cost-effective vehicle, to help provide balance to their overall portfolios. It has become more mainstream and ranks in the top three largest global convertible bond funds in Europe and is available with currency hedged share classes.
Over the past ten years, the fund has tracked its index very closely with an annualized tracking error of less than 0.2%. This has been achieved by employing a skilled portfolio management and trading team that has focused on idiosyncratic risks and transaction costs. On a gross-of-fees basis, the fund actually slightly outperformed its index, thanks to skilled execution of trading around index rebalancing and primary market issuance.
Today, the SPDR Refinitiv Global Convertible Bond UCITS ETF can be used by all investor types from insurance companies to wealth managers and multi-asset managers for both long-term and short-term exposures. Some of its key features6 are:
- A strong ten-year track record
- 3rd largest global convertible bond fund domiciled in Europe
- Attractive pricing at 0.50% TER unhedged and 0.55% hedged (EUR, CHF share classes are already seeded) versus most institutional share classes7
- Transparency: holdings are available every day on ssga.com and via tools like Bloomberg
- Physical replication
- Solvency 2 capital contribution relative to equities tend to be more attractive for convertible bonds.
Performance Versus Peer Group: Active Versus Passive?
The debate between active and passive never stops. The SPDR Refinitiv Global Convertible Bond UCITS ETF has performed very closely to its index (Refinitiv Qualified Global Convertible Bond Index) since its launch. That index outperformed the FTSE Global Focus Convertible Index, which is often used by active managers. The Qualified Index does not test on prices and premia — unlike the Focus Index — so it may be closer to the approach that an active manager would take, i.e., to hold bonds whose deltas rise, or buy bonds with lower valuations determining these could rise, or provide more yield in the portfolio.
For more index comparison details, see the Convertible Bond Indices Overview.
In Figure 5, we show the performance versus the universe of European domiciled convertible bond funds since the fund’s inception.
This group contains 132 funds as of 31 August 2024 for a total market value of US$32B. Funds may be more focused on balanced exposures; some may be euro only and others may be global hedged or unhedged. While the decision to hedge can be managed actively, we tried to look at the performance of the SPDR Refinitiv Global Convertible Bond UCITS ETF in USD unhedged terms in order to assess how the fund would have ranked versus the universe. Focusing on USD unhedged share classes to compare like for like, the universe contains circa 50 funds. All performance is net of fees.
Figure 5: Global Convertible Bond USD Unhedged Peer Group
Quintile Ranking - Global Convertible Bond Funds (USD Unhedged)

Over most periods in the past ten years, the SPDR® Refinitiv Global Convertible Bond UCITS ETF has been ranked around or above the 20th percentile. This helps demonstrate the advantage of a well-built and diversified index and a tight replication process.
The current market environment also makes convertible bond a potentially attractive diversifier in portfolios (both equity and fixed income) bringing a convexity profile that can complement traditional bonds.
The first 10 years of this unique global convertible bond ETF have demonstrated the robustness of the index construction, the ability of State Street Global Advisors portfolio management teams to track a less common universe, and for investors a unique way to get exposure to convertible bonds in a transparent, cost efficient, and liquid way.
Onwards to the next milestone.
For more information on convertible bonds please visit the convertible bonds page.
SPDR® Refinitiv Global Convertible Bond UCITS ETF
Annualised Performance (Net of Fees) as of 30 August 2024
| 1 Month (%) | 3 Months (%) | YTD (%) | 1 Year (%) | 3 Years (%) | 5 Years (%) | Since Inception* (%) | |
| SPDR Refinitiv Global Convertible Bond UCITS ETF | 2.19 | 4.08 | 5.51 | 10.08 | -3.48 | 6.29 | 5.26 |
| Refinitiv Qualified Global Convertible Index | 2.22 | 3.98 | 5.67 | 10.30 | -3.08 | 6.52 | 5.58 |
| Difference | -0.02 | 0.09 | -0.16 | -0.22 | -0.40 | -0.23 | -0.32 |
*Inception date: 14 October 2014. Source: State Street Global Advisors, Bloomberg Finance, L.P., as of 30 August 2024. Past performance is not a reliable indicator of future performance. Performance of the SPDR Refinitiv Global Convertible Bond UCITS ETF is net of fees in US$ unhedged. Investment return and principal value will fluctuate, so you may have a gain or loss when shares are sold.
Current performance may be higher or lower than that quoted. All results are historical and assume the reinvestment of dividends and capital gains. The contained performance data do not take account of the commissions and costs incurred on the issue and redemption, or purchases and sale, of units. Visit ssga.com for most recent month-end performance. Index returns are unmanaged and do not reflect the deduction of any fees or expenses. Index returns reflect all items of income, gain and loss and the reinvestment of dividends and other income as applicable. The calculation method for value added returns may show rounding differences. Performance returns for periods of less than one year are not annualized. Flows are as of date indicated, are subject to change, and should not be relied upon as current thereafter. Previous to 29 May 2020, the Fund was known as SPDR® Thomson Reuters Global Convertible Bond UCITS ETF (Dist). Effective 01/06/2020, the index name was changed from Thomson Reuters Qualified Global Convertible Index to Refinitiv Qualified Global Convertible Index.